Configure the Stats Engine and Validate Samples
This page answers one core question: how do you make the metric differences you see on the Results page trustworthy?
To make a number "trustworthy," two things must be true simultaneously:
- The statistical judgment is rigorous enough: the difference is not a product of random noise (control the false-positive rate)
- The samples themselves are comparable: the two variants being compared were balanced before the experiment began (control sampling bias)
ABC splits these two concerns into two tools: stats engine parameters handle item 1, and Experiment Backtrack validates item 2. Both are presented together on the Results tab; this page covers them end to end.
Scenario: A week later, the dashboard shows ad revenue at +1.2% — is this a real effect, or a weekend traffic-peak artifact? A P-value alone is not enough — you also need to confirm that the two variants' samples are comparable. This page walks through that complete judgment process.
Entry points
Stats engine parameters
Open the experiment's Results tab → click the Hypothesis testing parameters icon above the metrics table. A small panel opens with three settings (significance level, statistical power, FDR).
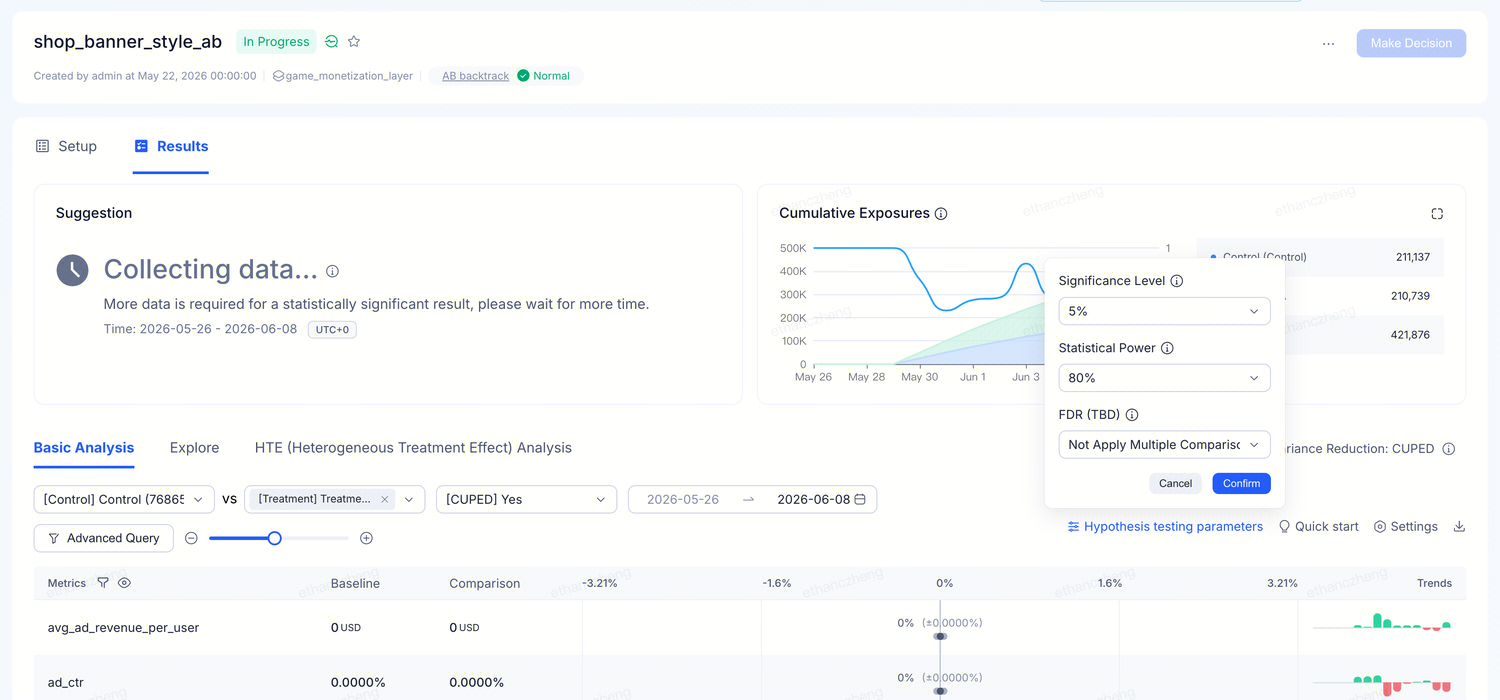
These settings affect the current view only — they do not change the experiment itself. Different people can view the same data with different thresholds without interfering with each other.
Backtrack tab
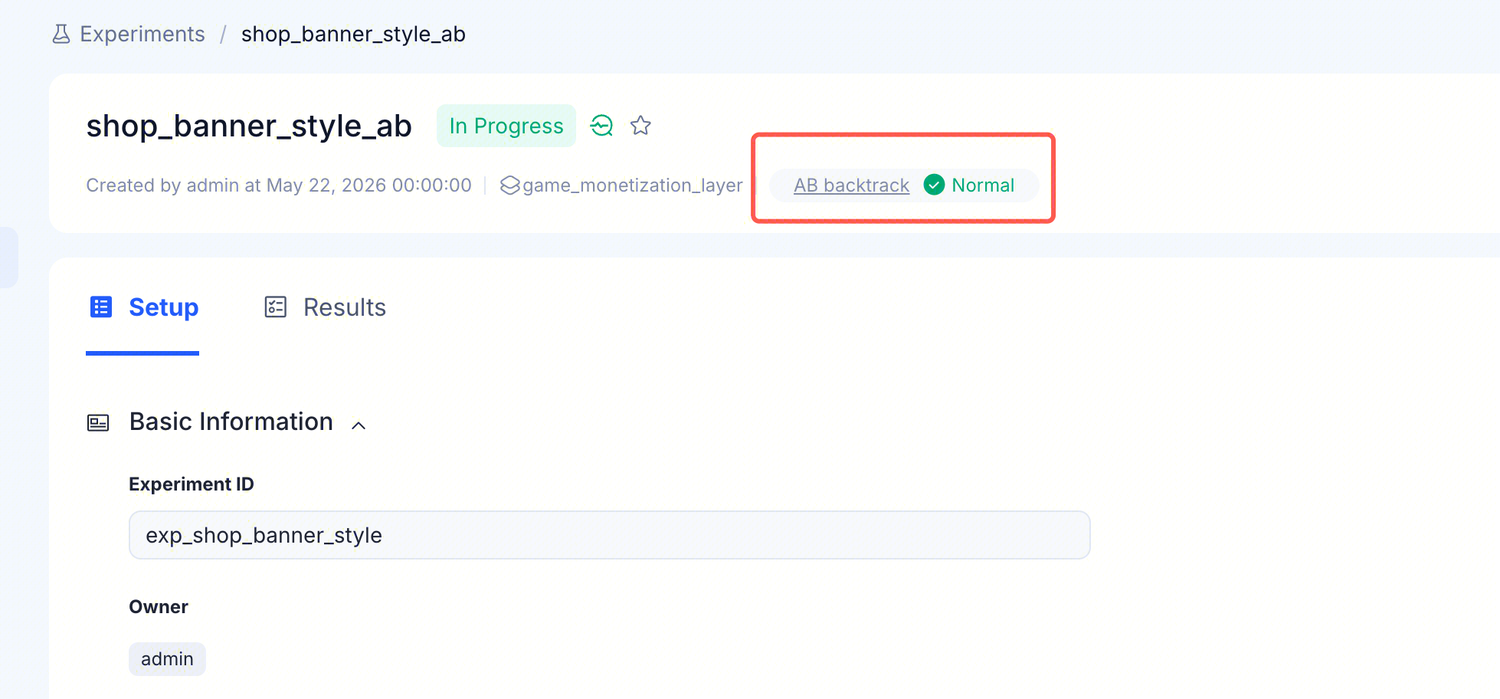
In the metadata bar shared by the Setup and Results tabs in the experiment detail page, there is an AB backtrack status label — this is the result of the platform's automated sample balance check. Click it to open the standalone backtrack page.
Control false positives: three core settings
1. Significance level
How strict the platform is when declaring a result "significant." Lower values are stricter — fewer false positives, but more data is needed to reach a conclusion.
| Option | When to use |
|---|---|
| 0.1% | Almost no false positives; suitable for extremely high-traffic scenarios where near-certainty is required |
| 1% | High-cost decisions, such as repricing for paying players |
| 5% (default) | Standard choice; balances reliability and time-to-conclusion |
| 10% | Early exploration; useful for getting directional signals first |
Game scenario: Testing a new diamond bundle price. Getting the price wrong means real money lost from paying players. Set to 1% — better to wait a few more days than to make a hasty decision.
2. Statistical power
The probability that the platform detects a real lift when one exists. Higher power means more sensitivity, but requires more data.
| Option | When to use |
|---|---|
| 60% | Acceptable to miss small effects; only want to catch large changes |
| 80% (default) | Standard choice; detects most meaningful effects |
| 85% | Use when DAU is very high; can detect improvements as small as +0.5% |
Game scenario: A hyper-casual game with 500K daily active users — sample size is not a bottleneck. Setting power to 85% allows you to detect even small retention improvements from onboarding optimizations.
3. FDR multiple comparison correction
When you examine many metrics at once, some may appear "significant" purely by chance. Enabling FDR correction prevents false positives.
| Option | When to use |
|---|---|
| Off (default) | Focused on 1–2 primary metrics; no correction needed |
| On | Simultaneously viewing 3 or more metrics; want to ensure that anything flagged as significant is genuinely real |
Game scenario: Evaluating a new daily check-in reward by looking at D1 retention, D7 retention, DAU, ad impressions, and IAP revenue simultaneously — five metrics. The probability of at least one "significant" result by pure chance across five is non-trivial. After enabling correction, any result that remains significant can be trusted.
Reach conclusions faster: CUPED variance reduction
CUPED uses each player's pre-experiment behavioral data to filter out natural noise — allowing you to reach a conclusion with the same number of players in less time.
On the Results tab:
- Each metric has a CUPED On / Off indicator
- When at least one metric has CUPED enabled, a Variance Reduction: CUPED banner appears at the top
- CUPED is on by default for all supported metrics; unsupported metric types show CUPED Off with a reason
Value for casual games: Player behavior is highly variable — some grind all weekend while others log in once a day. CUPED uses pre-experiment baselines to eliminate natural differences. Effect: an experiment may reach a conclusion in 5 days rather than 12.
See Variance Reduction for full details.
Sample comparability check: Experiment Backtrack
The previous three sections address the rigor of the statistical judgment. But rigorous judgment requires that "the samples are comparable in the first place" — if the Treatment and Control variants started with different user compositions (e.g., more heavy spenders ended up in Treatment), even a strict P-value is just putting a "significant" label on an illusion.
Experiment Backtrack is the backstop for this — it runs automatically on every experiment and answers one question:
Over the recent period, are the user compositions across variants truly comparable?
4 common usage scenarios
| Scenario | Business context | What Backtrack tells you |
|---|---|---|
| Early-experiment assignment bias | 2 days after launch, Treatment_A retention is 5% above Control — looks like a win | Label Normal → the 5% lift is credible; non-Normal → may be a coincidental bias from the early assignment period |
| Drift during a long-running experiment | Experiment runs 1 month; overall SRM passes, but Treatment unexpectedly reverses in the last week | SRM does not see recent drift; Backtrack covers only the last 3 / 7 days and can catch recent issues such as client bugs or uneven rollouts |
| Borderline result with uncertainty | P-value oscillates between 0.04 and 0.06 | Switch to the 7-Day window and check whether direction and magnitude are consistent with the 3-day view |
| Newly bound metric needs immediate verification | Concerned that the new and old metrics do not share the same sample baseline | Click Rerun Backtrack to recompute immediately; results in a few minutes |
Backtrack label states
| Display | Meaning | What to do |
|---|---|---|
- - | No backtrack result available yet (new experiment or no exposures yet) | Check whether a primary metric is bound and exposures have accumulated; if both are in place, wait a few hours |
| Normal | The most recent backtrack considers the variants to be balanced | You can trust the metrics table on the Results page |
The AB backtrack field is underlined and clickable — click it to open the standalone backtrack page with detailed per-metric comparisons.
Reading all four signals together: the standard decision checklist
Whether an experiment result is "truly trustworthy" requires reading several signals on the Results page together:
| Signal | What it tells you | What to do when it fails |
|---|---|---|
| AB backtrack label / page | Were the variants comparable over the last 3 / 7 days? | Switch to the 7-Day view; do not rush to a decision when non-Normal |
| Sample Ratio Mismatch (SRM) | Has the overall traffic split since the experiment started matched the configured allocation? | SRM failed → check the allocation configuration and experiment environment |
| Stats engine parameters | Under the current thresholds, is the judgment of the difference rigorous enough? | Tighten the significance level / enable FDR correction |
| Suggestion | The platform's synthesized recommendation for the next step (decide / wait / add metrics) | Follow the guidance to fill in the missing data before re-evaluating |
Decision path
Go through each item in order; all must pass before the result is "ready for a decision":
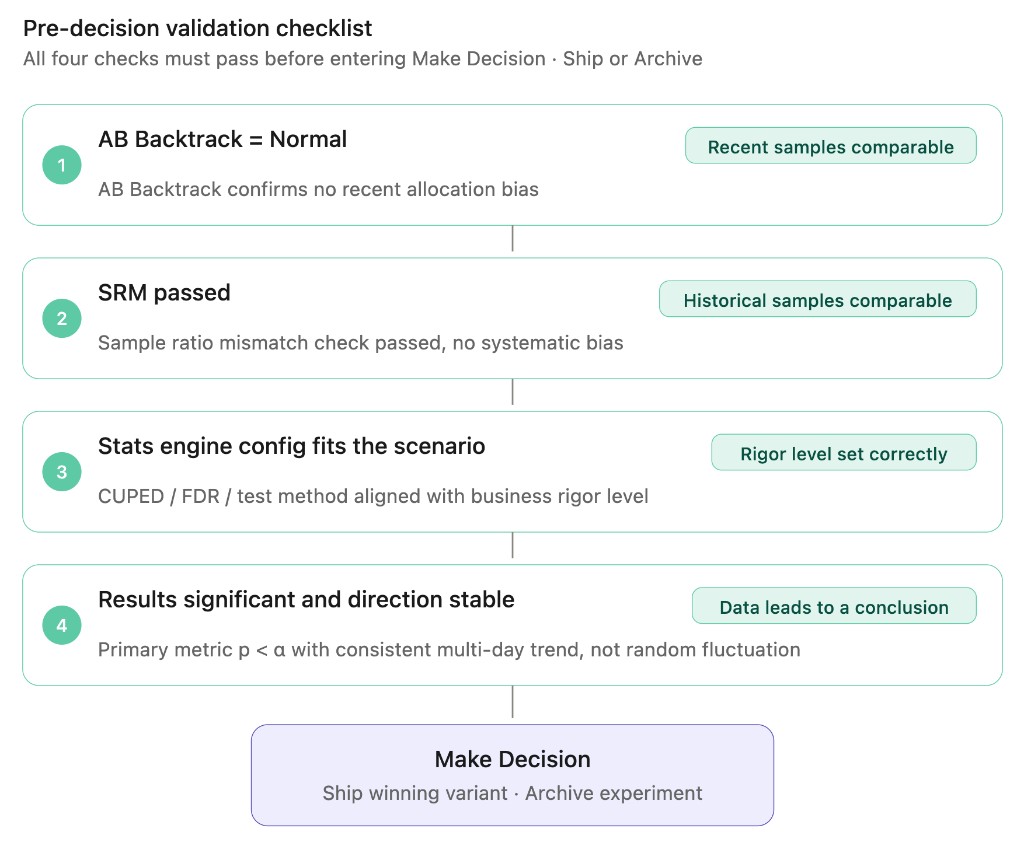
If any item fails, address it before making a decision.
Recommended defaults
When in doubt, use the defaults:
| Setting | Default | When to adjust |
|---|---|---|
| Significance level | 5% | Tighten to 1% for payment-related experiments; loosen to 10% for early exploration |
| Statistical power | 80% | Raise to 85% when DAU is high to capture small lifts |
| FDR correction | Off | Turn on when viewing 3 or more metrics simultaneously |
| CUPED | Auto-enabled | Accept the platform's judgment by default; no manual adjustment needed |