Read Results
This page helps you understand what each item on the Results tab means once your experiment is running. Walk through the page from top to bottom.
Why this matters: Your puzzle game has been running a new reward popup test for a week. The Results page shows green bars, gray bars, and various percentages — what do they mean? After reading this page, you will be able to confidently decide whether to ship, keep running, or end the experiment.
Still configuring the experiment? See Create and Launch an Experiment and Configure the Stats Engine and Validate Samples first.
Entry point
Click Experiments in the left navigation → select an experiment to open the detail page → switch to the Results tab. The experiment status is always shown in the page header; the Make Decision button also appears here while the experiment is running. 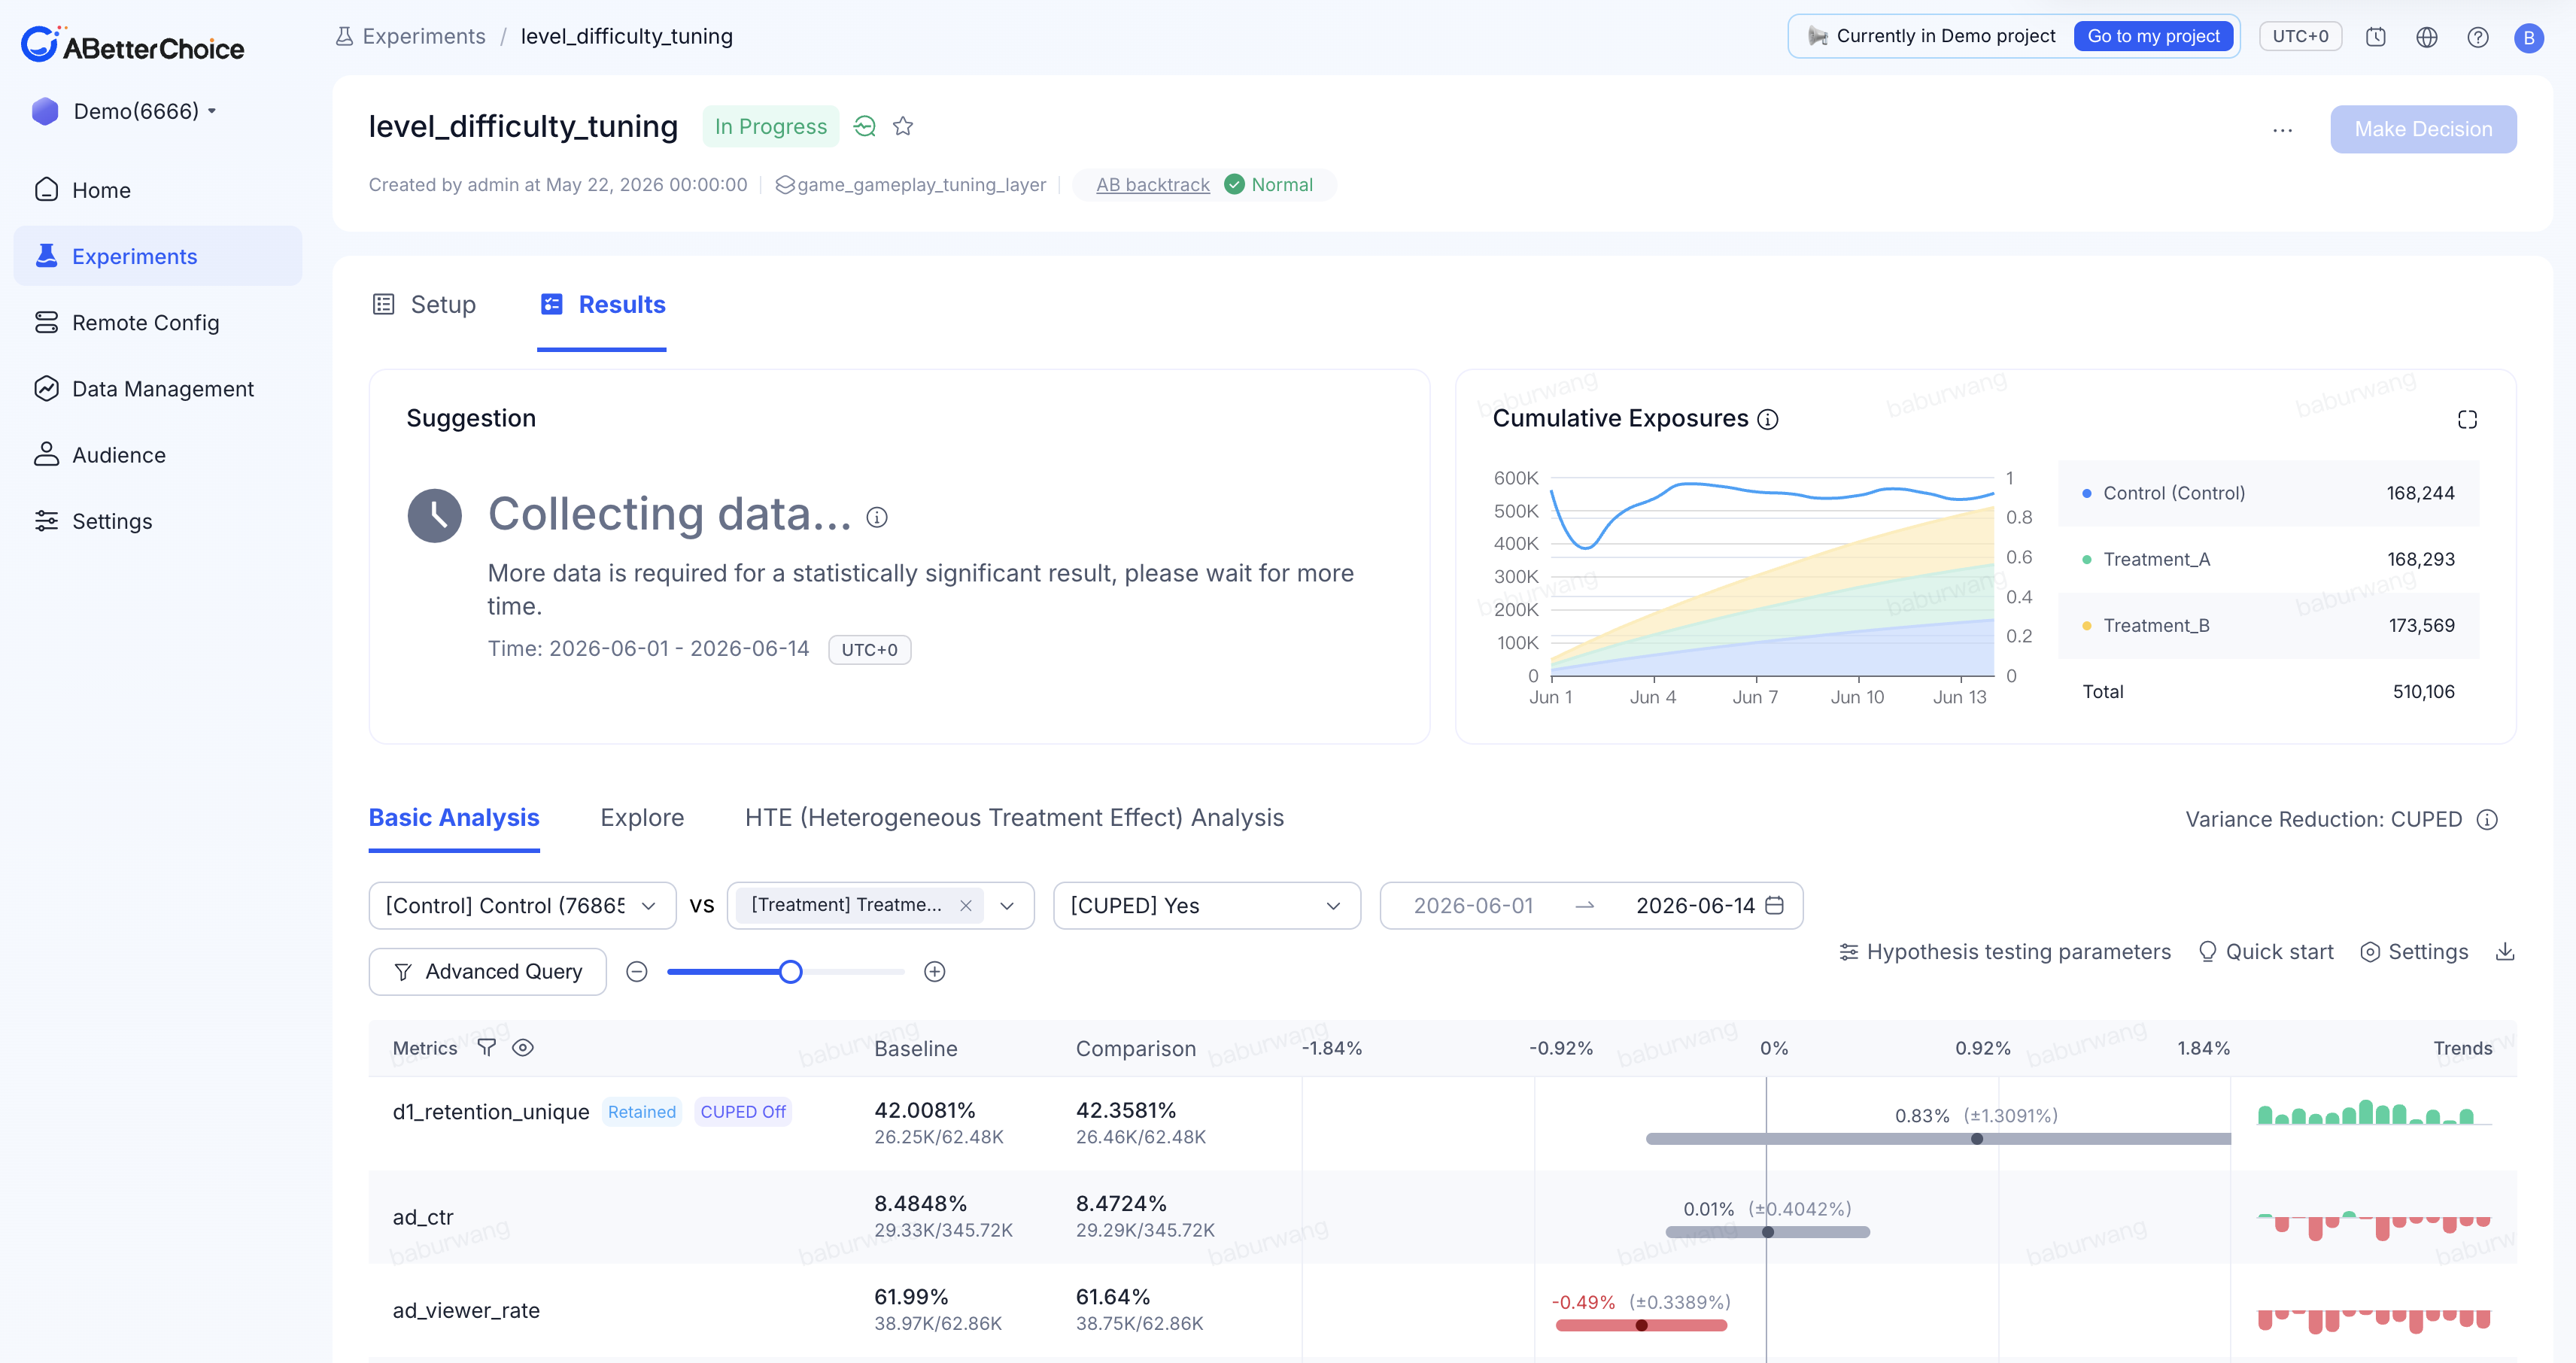
Sharing tip: The page URL encodes all the settings you are currently viewing. Send it to a teammate and they will see exactly the same view you see — no additional explanation needed.
Reading from top to bottom
1. Suggestion banner
A one-line conclusion at the top of the page that tells you the current state of the experiment.
| What you see | What it means | Next step |
|---|---|---|
| Suggestion to add primary metrics | No primary metric selected | Add one to see comparison charts |
| Collecting data… | Not enough data yet | Let the experiment keep running |
| A better group has been found | A significant winner exists | Evaluate whether to Ship |
| No winning variant found | Ran to completion with no significant difference | Evaluate whether to Archive |
| Risk warning (red) | A high-risk condition was triggered | Stop reading the headline — investigate first |
Game scenario: You launched a new onboarding A/B test yesterday and open Results today to see Collecting data… — this is normal. Most casual games need 7–14 days to accumulate enough signal; do not rush to conclusions.
2. Cumulative Exposures
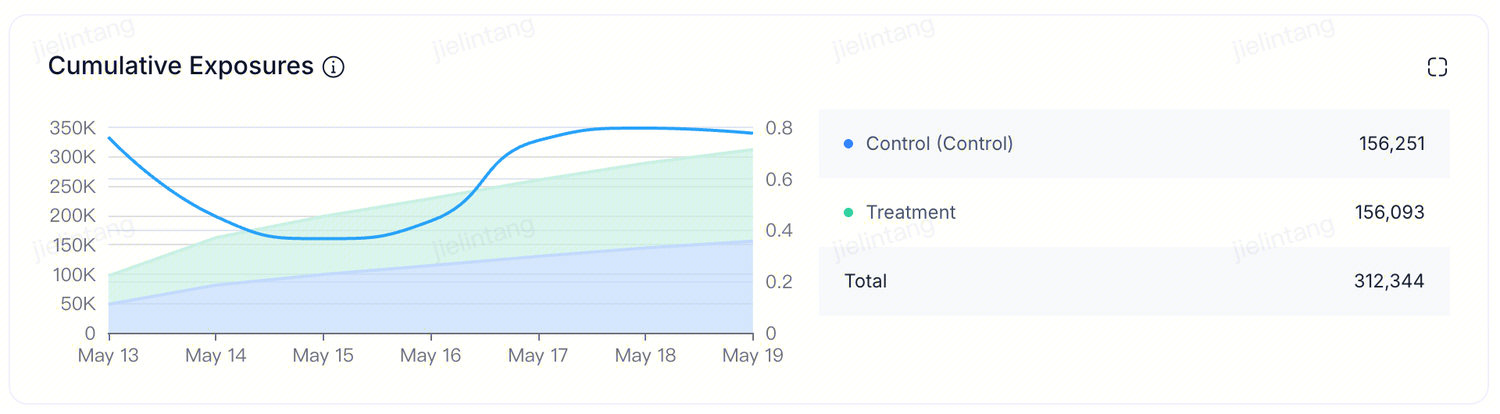 At the top of the results page is the cumulative exposure trend chart. An exposure is a deduplicated count of experiment units that have entered the experiment — typically deduplicated users, or devices for device-level experiments. The timeline shows when the experiment started and how many exposures entered each day. You can view the rate at which users are assigned to each variant, the total cumulative exposures, and verify that the actual traffic split matches the target allocation configured in the experiment setup.
 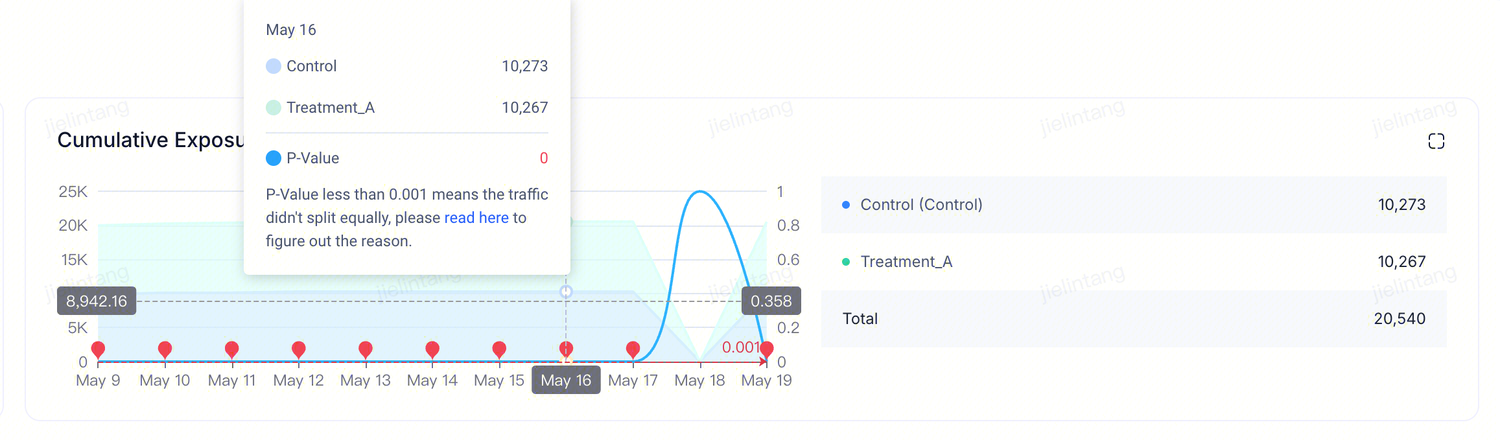 When a Sample Ratio Mismatch (SRM) is detected, the chart marks the affected point in red. The cause is that the cumulative exposure proportion across variants does not match the traffic allocation configured in the experiment setup.
3. Three analysis views
| View | Purpose |
|---|---|
| Basic Analysis (default) | "Did this experiment win?" — a head-to-head comparison of Control versus one Treatment |
| Explore | View metrics outside the experiment's metric set, or compare multiple Treatments simultaneously (up to 30 metrics × 5 variants) |
| HTE Analysis | Suspect the effect is concentrated in a specific player segment (e.g., payers vs. non-payers) and want to confirm |
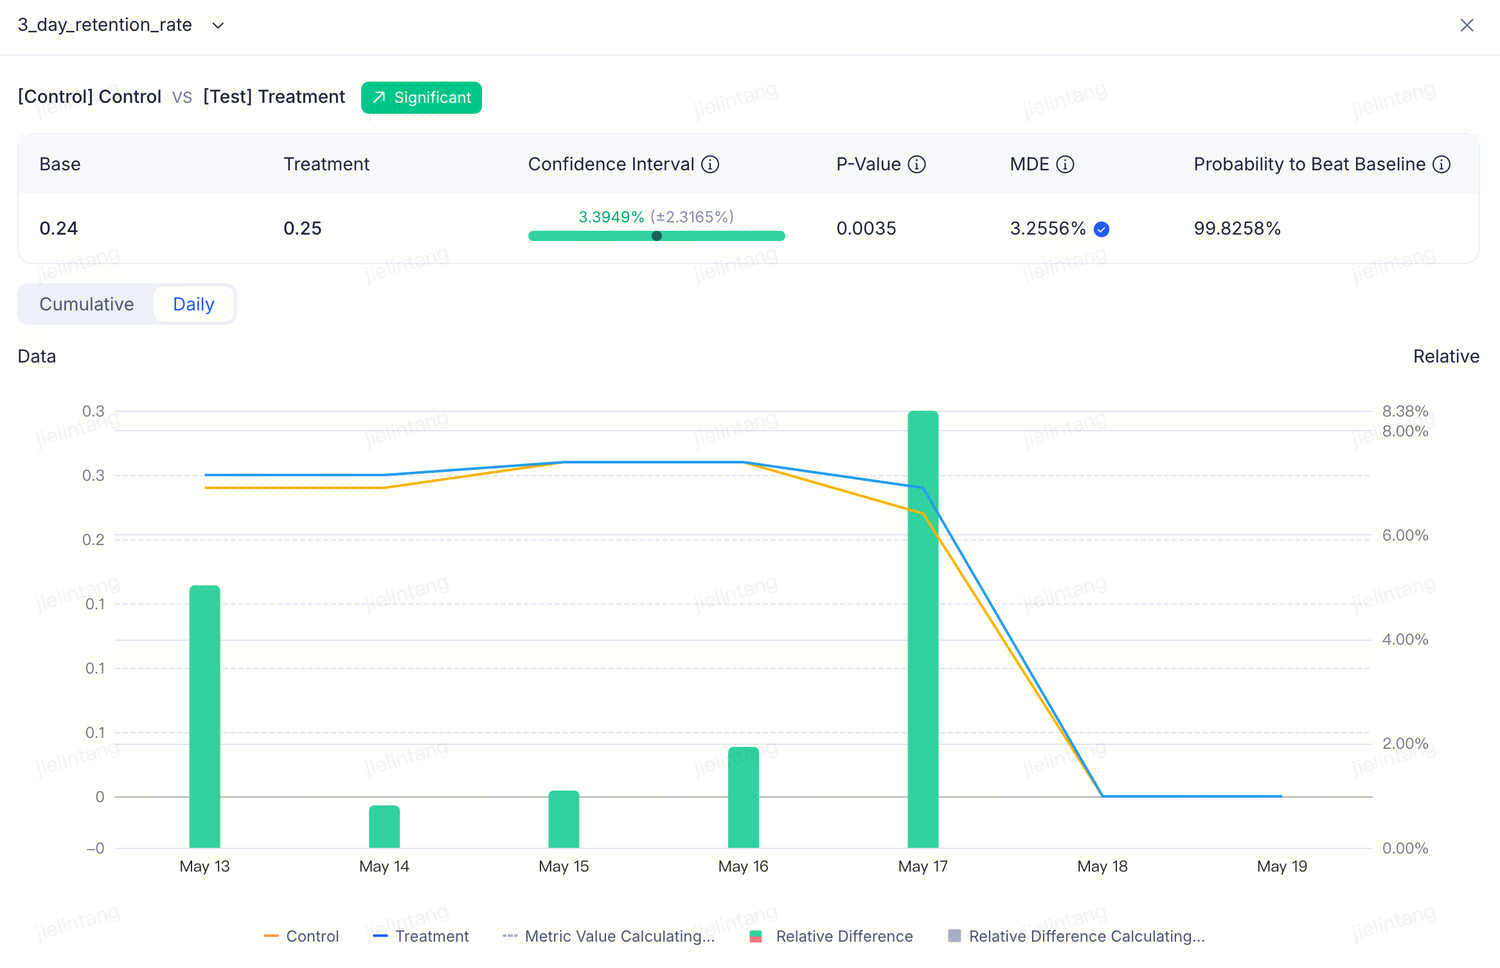
Basic Analysis
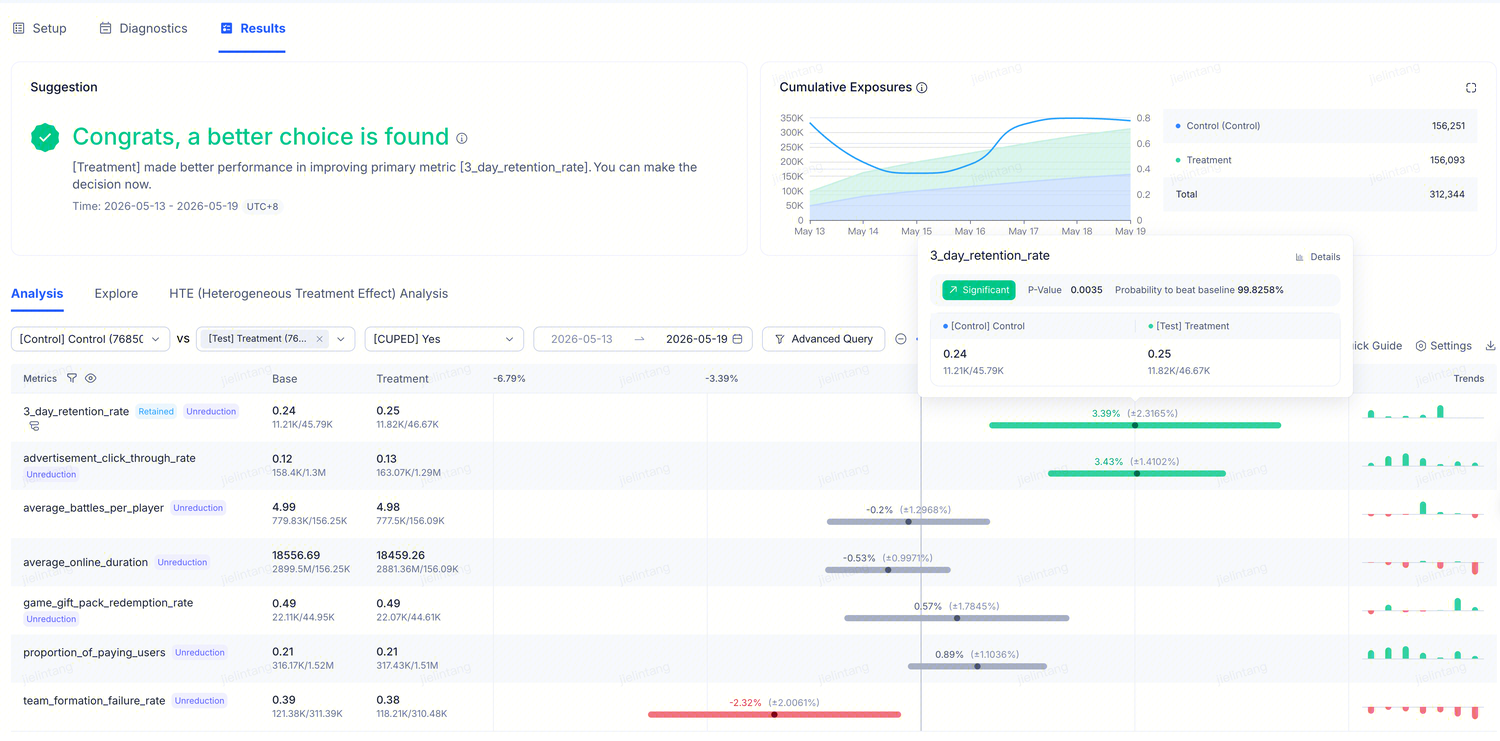 Displays the relative difference (lift) across all metrics you configured when creating the experiment. The experiment "Results" job runs daily, computing the difference between random variants (such as Treatment vs. Control) for each metric and performing statistical tests on the results.
Header
The metrics table compares Control and Treatment row by row:
| Column | Meaning |
|---|---|
| Metric name | May include a CUPED On / Off indicator |
| Baseline | The Control variant's value |
| Comparison | The Treatment variant's value |
| Relative difference | How much Treatment changed relative to Control, with confidence interval |
| Trends | A small sparkline showing how the difference has changed over time |
Color coding:
- Green — Treatment is significantly better than Control (won)
- Red — Treatment is significantly worse than Control (problem)
- Gray — No significant difference yet
Game scenario: Testing whether a spin-the-wheel animation improves D7 retention over a static chest. After 10 days, the retention row shows green at +2.3%, and guardrail metrics (ARPU, ad watch rate) are gray — a clean win; the spin wheel can be shipped with confidence.
 The relative difference (lift) formula is: Delta(%) = (Test - Control) / Control. The confidence interval is computed based on the selected significance level (default 95%).
CUPED indicator
- CUPED On = variance reduction is active; results are more reliable
- CUPED Off = this metric type is not supported; hover to see the reason
CUPED can typically let an experiment reach a conclusion 3–7 days earlier — by eliminating natural behavioral variation among players (heavy weekend play vs. occasional weekday sessions) to reduce noise.
Explore
Ad-hoc queries without changing the experiment configuration. Select metrics, select variants, set a date range, and click Query.
When to use it:
- Compare all Treatments against Control in a single view
- A teammate asks "did session length change?" — a metric not in the experiment's main metric set
- Explore an idea on the fly without touching the experiment itself
Game scenario: The primary metric is D7 retention, but a monetization colleague wants to know whether the new popup affects IAP conversion rate. Open Explore, add the IAP conversion metric — no need to modify the experiment setup.
HTE (Heterogeneous Treatment Effects) analysis
Answers the question: "Is the effect the same for all players, or do different segments show different responses?"
Steps:
- Select the baseline group at the top (defaults to Control)
- Set a date range
- To filter a specific segment, click Sample Filtering to add filter conditions
- Under Metrics, add the metrics you care about (up to 10)
- Under Group By, select a segmentation dimension (player level range, country, spending tier)
- Click Query
Query results appear in the Metric Details section below, showing the treatment effect difference across each sub-segment. When there are multiple treatment variants, you can enable Multiple Comparison Correction in the top-right corner to control the false-positive risk.
Game scenario: A new difficulty curve shows a weak positive lift overall. But when segmented by player level, players at level 50+ show +5%, while new players show –1%. HTE surfaces this — if you had shipped to everyone without segmenting, new players would churn faster due to mismatched difficulty, and the "weak positive lift" in overall retention would have been an illusion driven by experienced players.
Experiment Backtrack: a second check on sample balance
Backtrack is a sample balance check that ABC runs automatically on every experiment. It answers: "Are the variants truly comparable over the recent traffic period?"
Results are shown in two places:
- A small label in the experiment header (Normal /
- -placeholder) - A standalone backtrack page listing detailed per-metric differences
Practical usage:
- See Normal → you can trust the Suggestion and metrics table
- See
- -→ the experiment has not yet accumulated enough data; check back in a few hours - Borderline result and unsure → switch to the 7-Day tab and compare direction and magnitude against the 3-day view
- Just added a new metric → click Rerun Backtrack to recompute immediately
Backtrack vs. SRM: both check balance, but with different scopes — SRM covers the entire experiment from start to present; Backtrack covers only the most recent 3 or 7 days. For a long-running experiment that started cleanly but drifted later, SRM may pass while the 3-day Backtrack does not.
Full details in Configure the Stats Engine and Validate Samples.
Advanced Query: force a recompute
The Advanced Query button (next to the date picker) forces a fresh computation. Use it when:
- You just added a new metric and do not want to wait for tomorrow's automated run
- The metric definition or data source was updated and the numbers need to be refreshed
Click it, select the metrics to recompute, and click Query. To recompute from scratch across all data, enable the Rerun Data toggle.
Next step: make a decision
Once you have read the results, click the Make Decision button at the top of the experiment to ship the winning variant or archive the experiment. See End an Experiment and Make a Decision.