Best Practices — Interpreting HTE Results
HTE conclusion overview
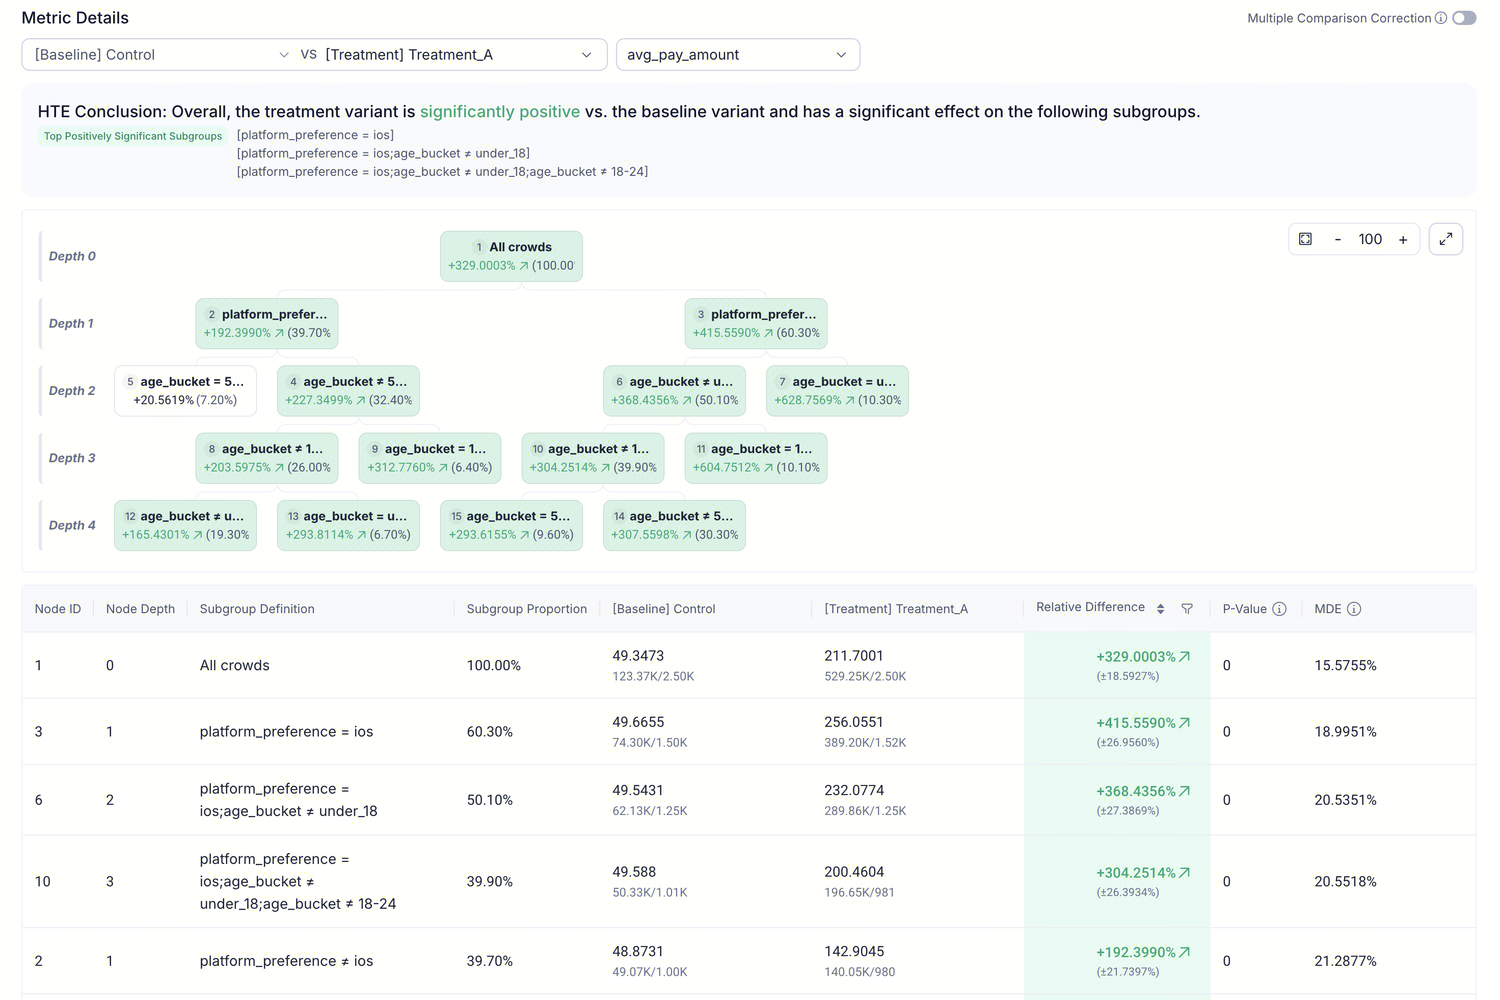
Using the example above, the conclusion area shows:
HTE Conclusion: Overall, the treatment variant is significantly positive vs. the baseline variant and has a significant effect on the following subgroups.
Three steps to interpret:
| Step | What to look at | Conclusion for this example |
|---|---|---|
| 1 | Overall effect direction | Treatment is significantly positive overall (+329%) |
| 2 | Which subgroups are significant | Top Positively Significant Subgroups lists 3 significantly positive subgroups |
| 3 | Which subgroup has the strongest effect | iOS users have the strongest effect (+415.56%) |
Reading the tree diagram
HTE uses a decision tree to automatically segment users into subgroups; each node represents a subgroup.
Tree structure
| Level | Meaning | Example |
|---|---|---|
| Depth 0 | All users (root node) | All crowds, +329% |
| Depth 1 | Split by the first dimension | iOS vs. non-iOS |
| Depth 2+ | Further split by other dimensions | Further split by age group |
Interpreting node information
Each node shows two numbers:
- Relative lift: the magnitude of improvement in the treatment group relative to the control group
- Proportion: the share of that subgroup in the total user population (60.30% means iOS users make up 60.3% of all users)
Color meaning
- Green / cyan: positive effect (treatment group outperforms control group)
- Red / pink: negative effect (treatment group underperforms control group)
Reading the table data
The table below the tree is the detailed HTE data. Key column descriptions:
| Column | Meaning | What to focus on |
|---|---|---|
| Subgroup Definition | Subgroup definition (dimension conditions) | Understand the characteristics of this subgroup |
| Subgroup Proportion | Subgroup share | Determine whether the subgroup is large enough to warrant a separate decision |
| Baseline / Treatment | Control group vs. treatment group metric values | Understand absolute magnitudes |
| Relative Difference | Relative lift (with confidence interval) | Core metric — judge effect size |
| P-value | Significance test | p < 0.05 is required to consider a subgroup effect significant |
| MDE | Minimum Detectable Effect | Determine whether the subgroup is adequately powered |
Key data interpretation for this example
| Subgroup | Proportion | Relative lift | P-value | Interpretation |
|---|---|---|---|---|
| All crowds | 100% | +329% | 0 | Overall effect is extremely strong and significant |
| iOS users | 60.30% | +415.56% | 0 | Stronger than overall; main driver |
| iOS + non-under_18 | 50.10% | +368.44% | 0 | Effect remains very strong after excluding underage iOS users |
| iOS + non-under_18 + non-18-24 | 39.90% | +304.25% | 0 | Effect drops slightly but remains very strong after further excluding 18–24 year-olds |
| Non-iOS users | 39.70% | +192.40% | 0 | Also significant, but notably smaller than iOS |
Key findings
- iOS is the core driver: iOS users (60.3%) contribute the strongest positive effect (+415.56%) and are the primary driver of the overall significance.
- Android/other platforms also benefit: Non-iOS users (39.7%) also see a +192.40% lift, just smaller in magnitude.
- Age affects iOS users: As under_18 and 18-24 users are excluded, the relative lift decreases from +415% → +368% → +304%, indicating that younger iOS users respond more strongly.
- All p-values are 0: The effects of all key subgroups are highly significant.
Making decisions based on HTE
Decision framework
Step 1: Check whether the overall effect is significant
  → Not significant: stop the analysis; address the power issue first
  → Significant: proceed to Step 2

Step 2: Identify which subgroups are significant
  → All subgroups point in the same direction: launch to everyone
  → Some subgroups point in the opposite direction: consider a targeted launch

Step 3: Evaluate whether subgroup differences warrant a segmented decision
  → Large difference + subgroup is targetable → segmented strategy (e.g., launch only to iOS users)
  → Small difference or not targetable → launch to everyone
Decision recommendations for this example
| Option | Analysis | Recommendation |
|---|---|---|
| Full launch | Overall significant (+329%); all subgroups positive | Safe choice |
| iOS-first | iOS effect is strongest (+415%); non-iOS also has effect (+192%) | If resources are limited, prioritize ramping up on iOS |
| Exclude specific subgroups | No clearly negative subgroups | No exclusions needed |
⚠️ Notes:
- HTE involves multiple testing (hypothesis testing across multiple subpopulations) and theoretically requires correction (e.g., Bonferroni). If the platform's Multiple Comparison Correction toggle (top-right) is enabled, results are more trustworthy.
- When a subgroup proportion is too small (e.g., < 5%), interpret the result with caution even if the p-value is significant.