HTE Quickstart
Pre-use checks
Verify account and environment permissions
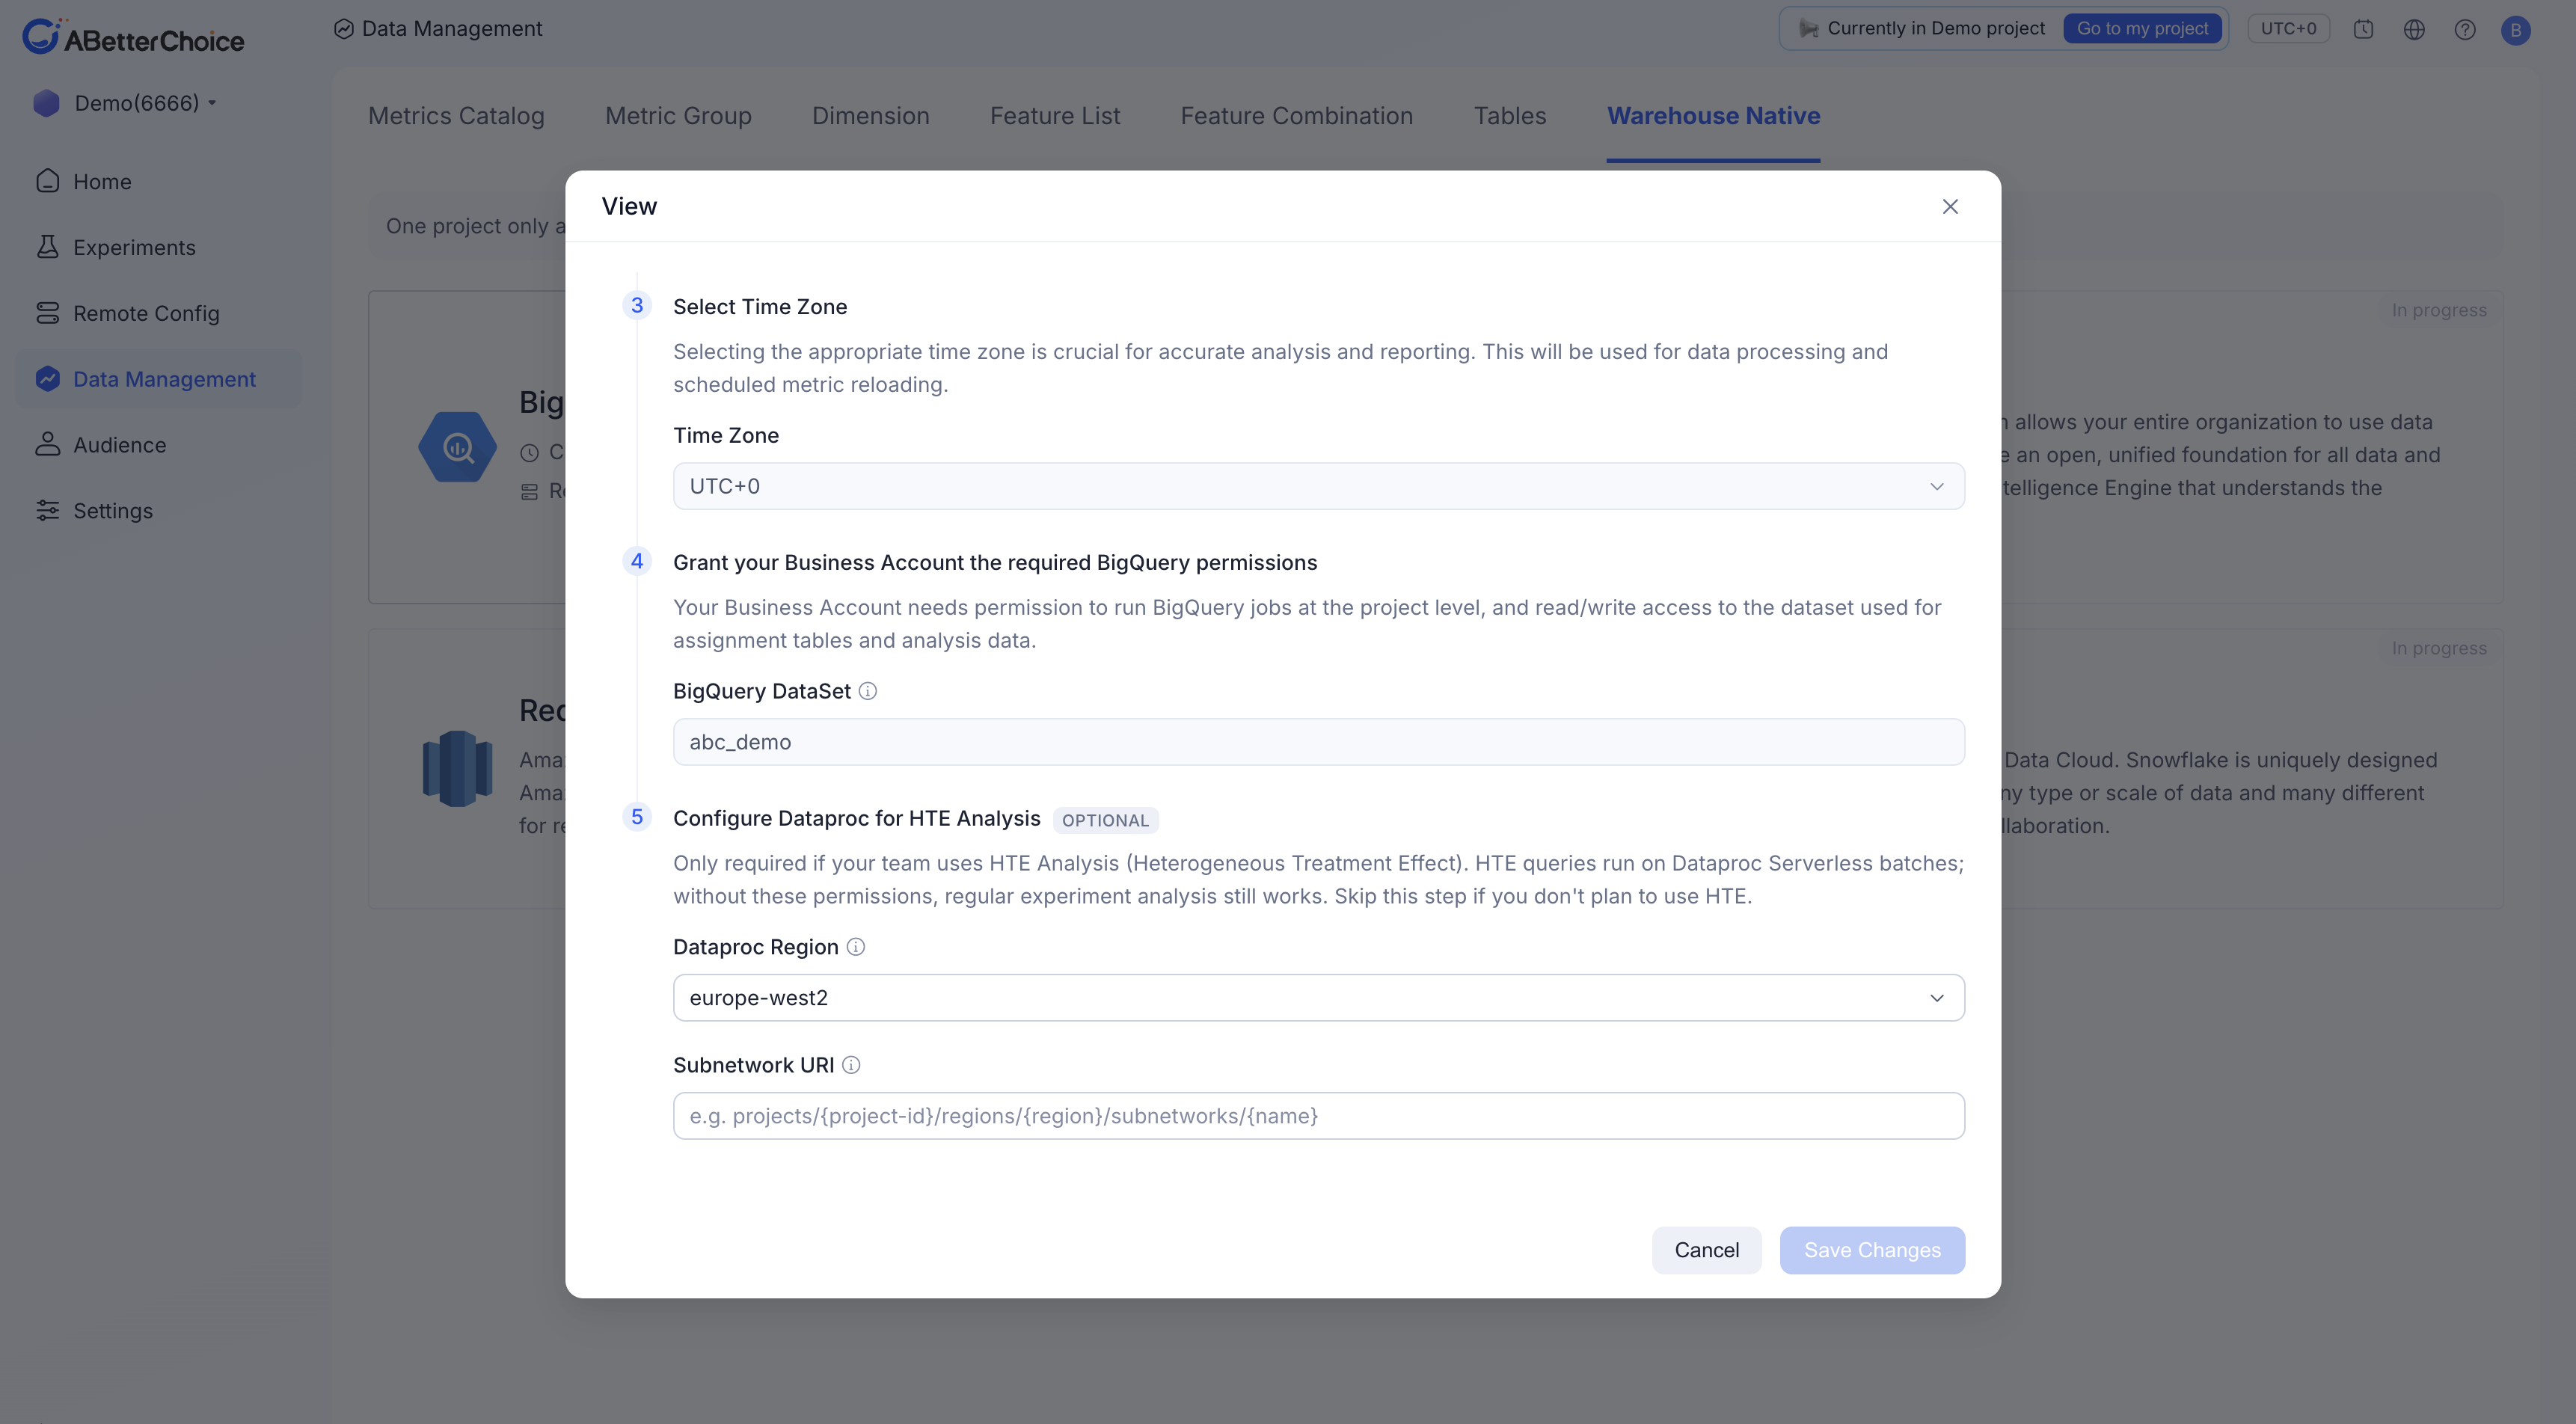
Before creating an HTE analysis task, confirm that the relevant configuration has been completed in the platform under Data Management / Warehouse Native / BigQuery. When an HTE task runs, the platform submits the corresponding PySpark script to Dataproc in your configured GCP project. Confirm the following permissions and resources are available in advance:
- Dataproc execution environment is available: Ensure Dataproc jobs can be submitted normally in the GCP project, and that the configured Subnetwork URI is correct and available.
- Sufficient data source read permissions: The script needs to read the metric data tables, feature association tables, and other source tables required by the HTE analysis. Ensure the running account has read access to these data sources.
- Sufficient BigQuery write permissions: The script writes HTE intermediate results to the BigQuery Dataset configured in the platform. Ensure the running account has write access to that Dataset.
- Platform-side configuration is complete: Confirm that the GCP project, BigQuery Dataset, Dataproc runtime environment, Subnetwork URI, and other related configurations have been completed and saved on the platform's Data Management / Warehouse Native / BigQuery page, so that the HTE task can read and use these configurations when it runs.
If any of the above permissions or resource configurations are incomplete, HTE task creation may fail, the task may fail to run, or analysis results may not be generated correctly.
Verify the experiment has run and accumulated sufficient samples
Ensure that within the selected time range, both the control group and every treatment group have accumulated sufficient samples. We recommend at least 300 samples per group and at least 1,000 total samples per "treatment group vs. control group" pair; otherwise HTE may be unable to identify stable subpopulations, or results may exhibit high variance, wide confidence intervals, or insufficient statistical significance.
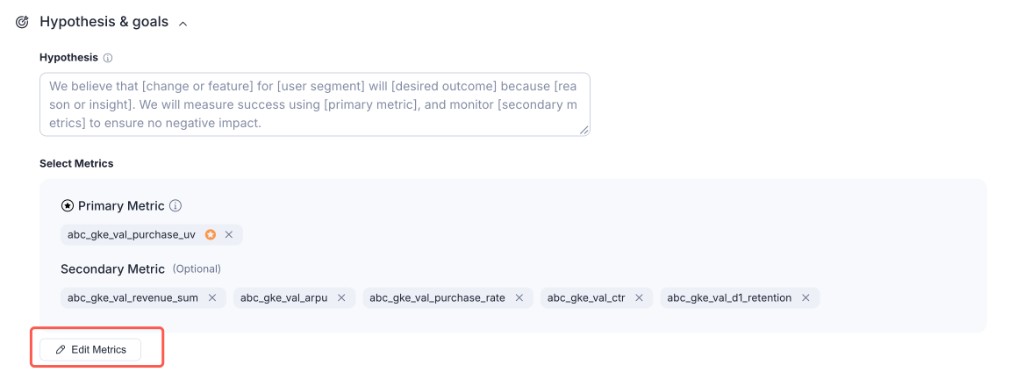
Verify that target metrics are configured
Ensure your experiment has at least one metric associated with it. If you have not yet created a metric, go to Data Management / Metrics Catalog to create one and associate it with your experiment.
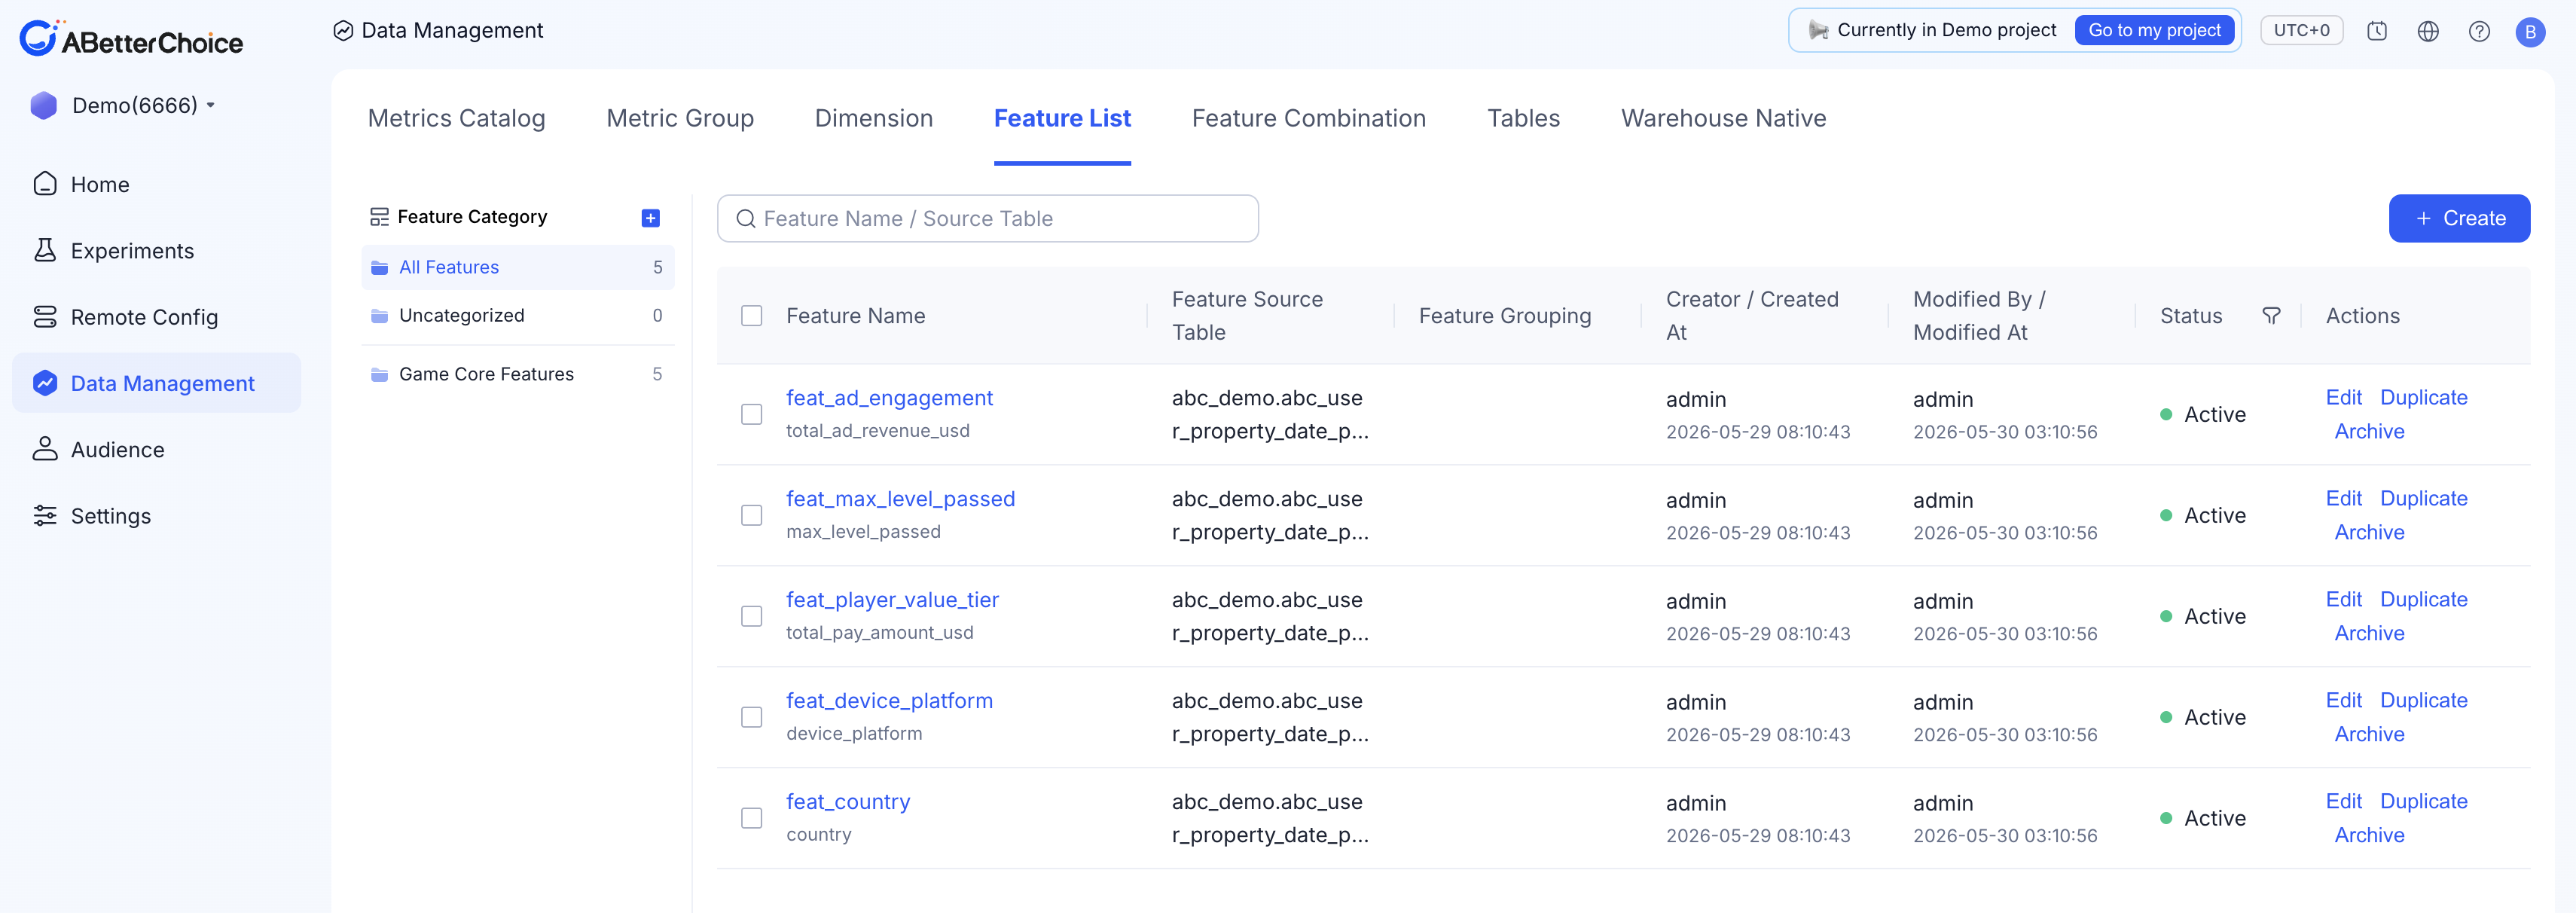
Verify that user features are available
Ensure you have created at least one user feature. If you have not yet created a feature, go to Data Management / Feature List to create one.
Create an HTE analysis
After completing the pre-use checks, follow these steps to create an HTE analysis task:
- Go to the experiment detail page Open the experiment you want to analyze and navigate to the corresponding experiment detail page.
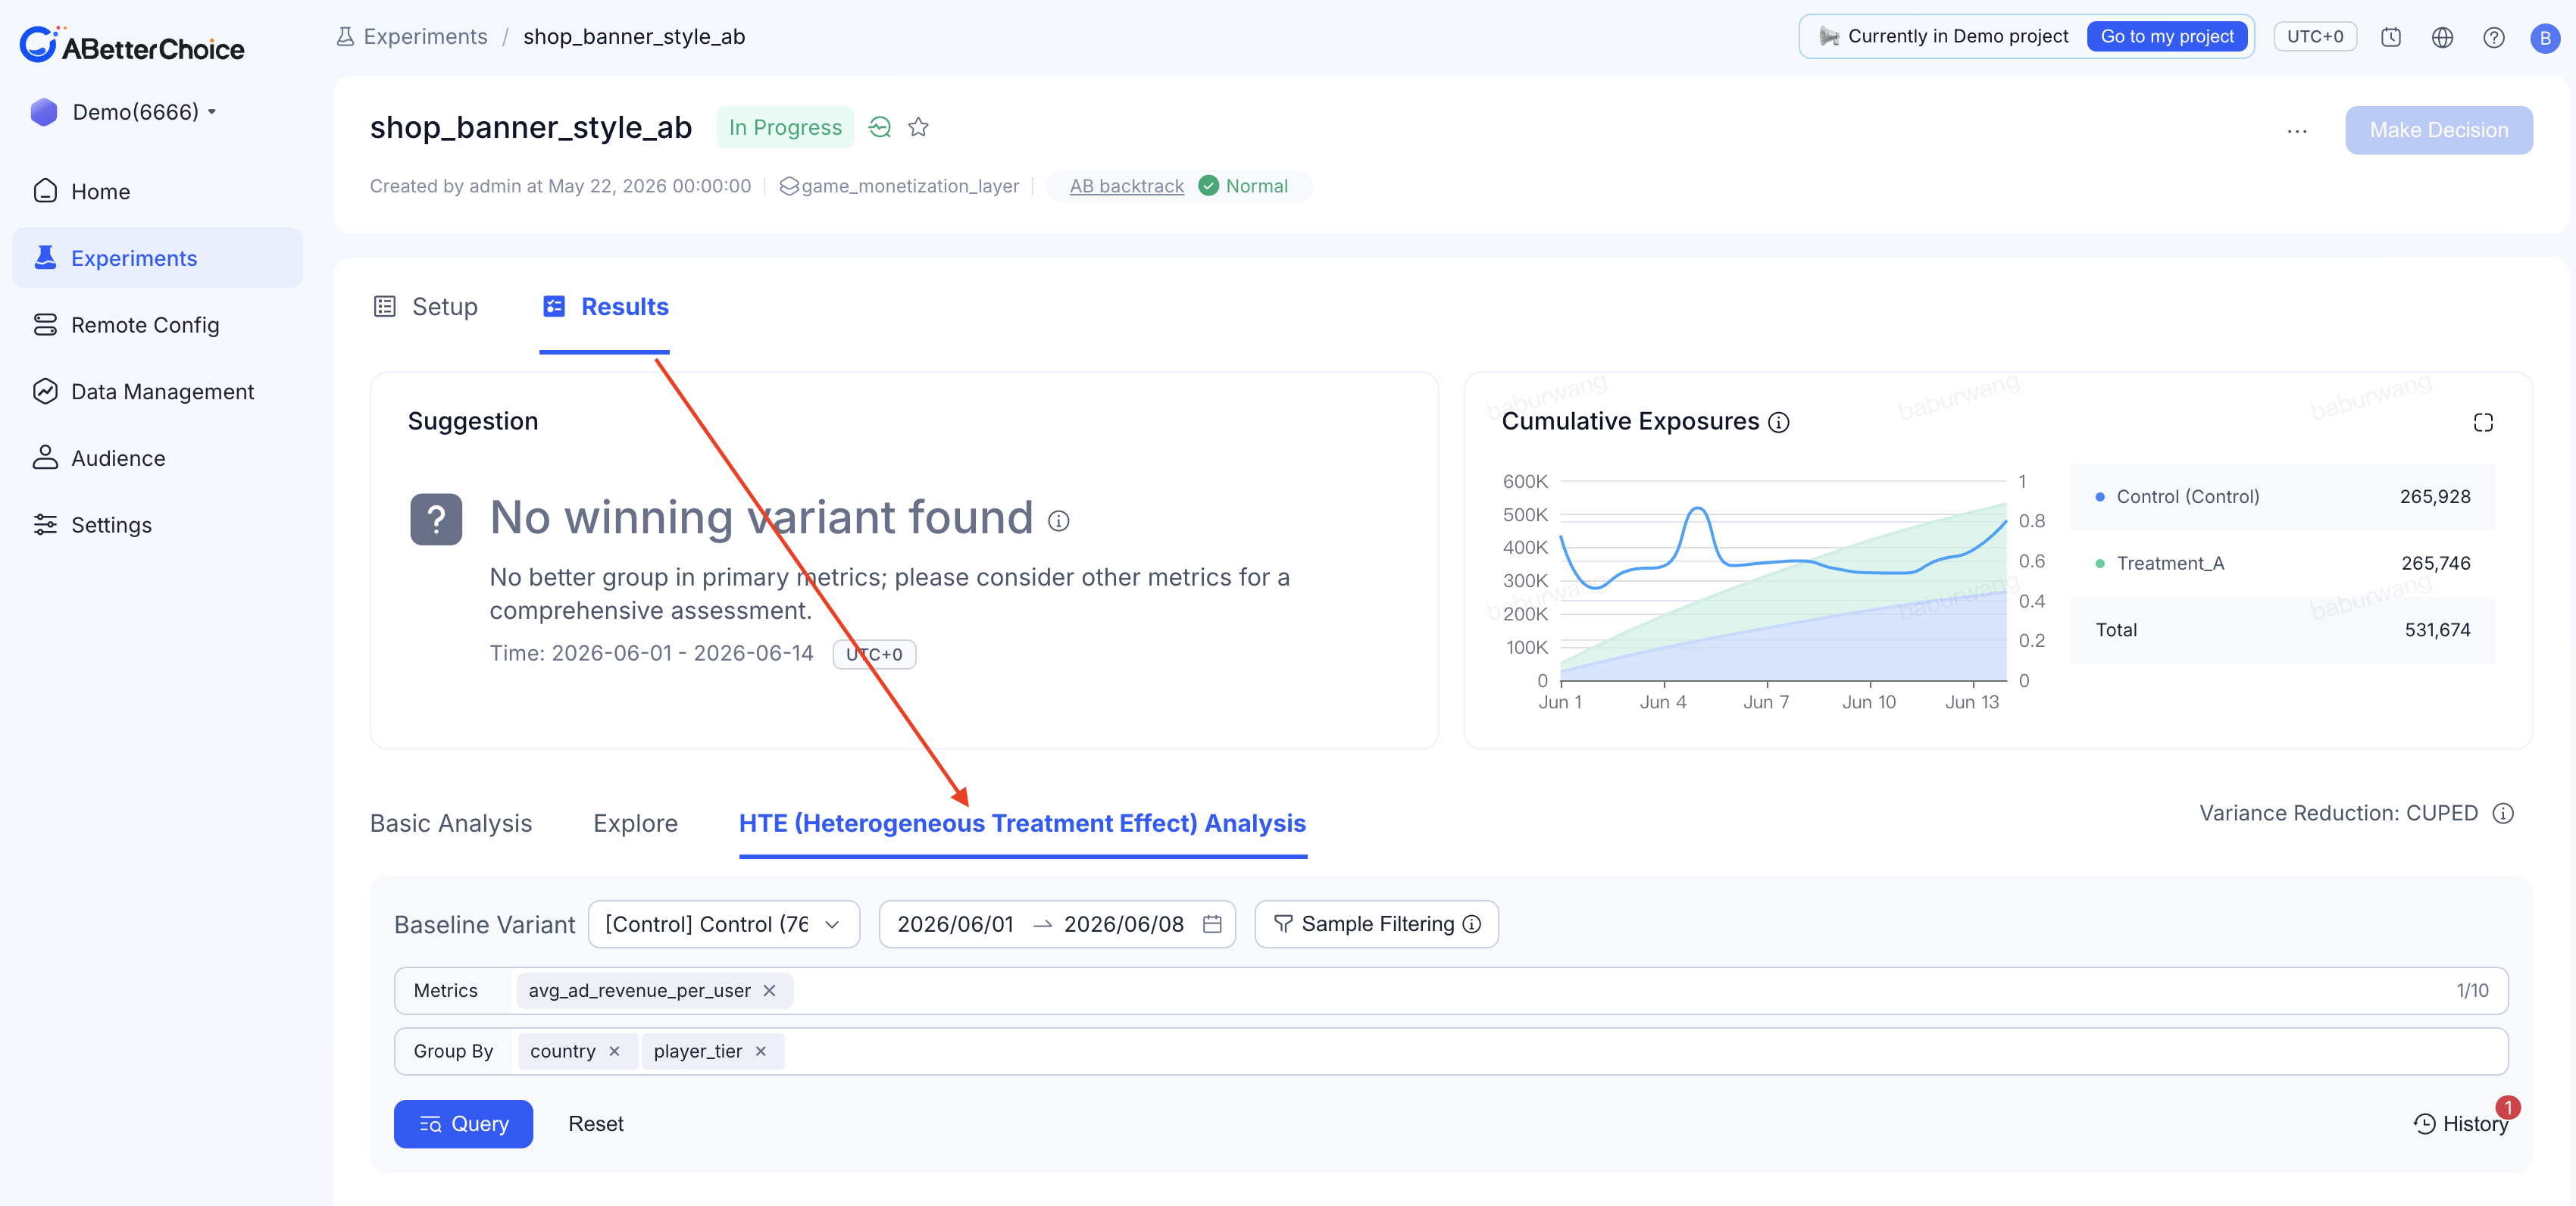
- Enter the HTE analysis entry point In the Results tab of the experiment detail, find the HTE (Heterogeneous Treatment Effect) Analysis entry and navigate to the HTE analysis configuration page.
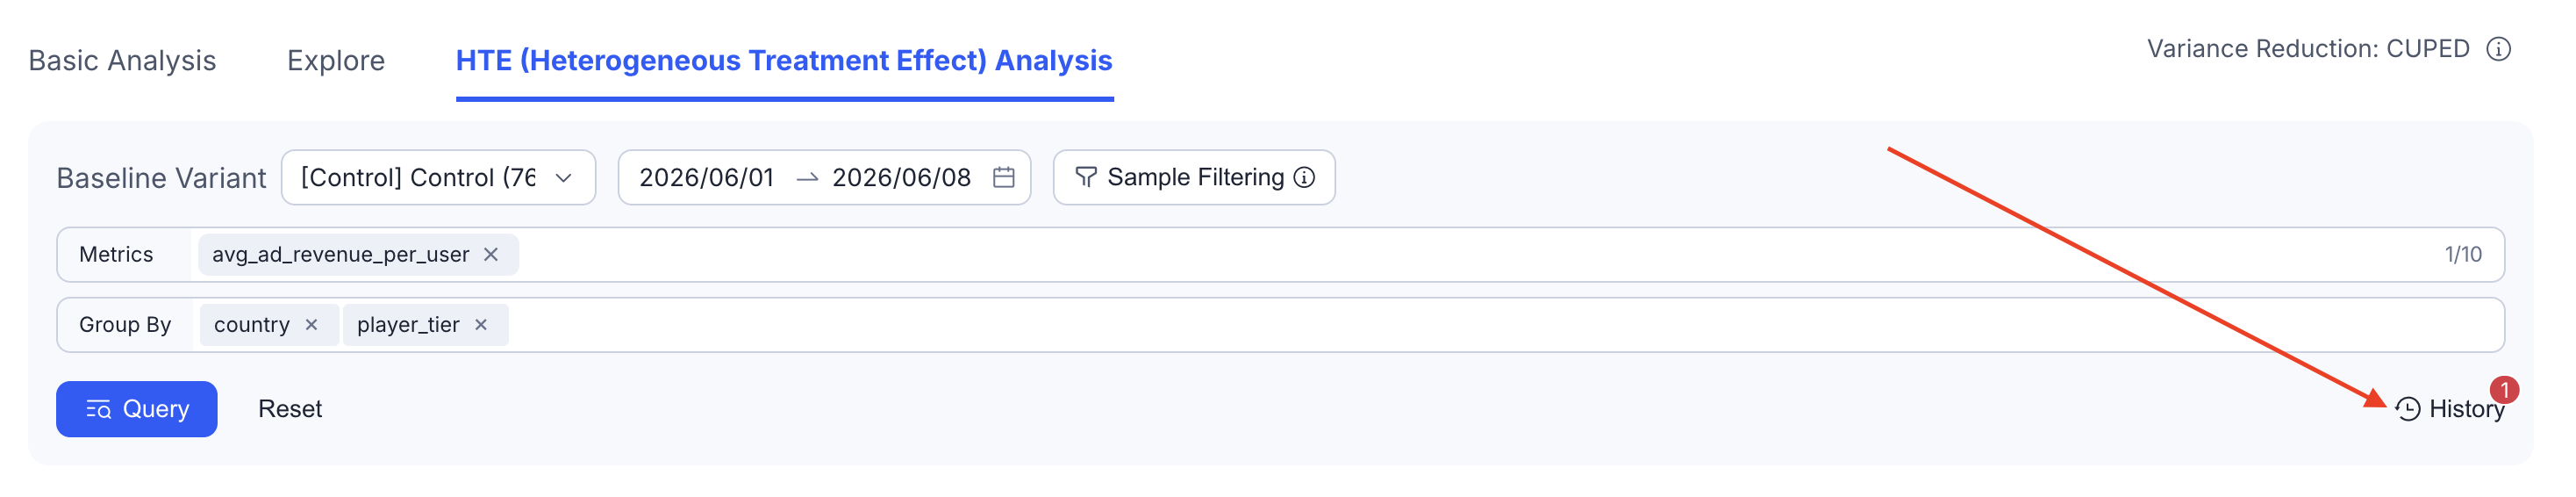
- Select Query Date Select the data time range for this HTE analysis. The system will analyze experiment exposure, metrics, and feature data within that time range.
- Select Metrics Select the experiment metrics to analyze, such as payment conversion rate or average payment amount per user. We recommend prioritizing the primary metrics most relevant to the experiment goal.
- Select Features Select the user features to use for identifying heterogeneous effects, such as user lifecycle segment, spending tier, age group, or platform preference.
- Click Query to create the analysis task After confirming that Query Date, Metrics, and Features are configured correctly, click Query to submit the task. The system will create and run the HTE analysis task; once the task is complete, you can view the differences in experiment effects across subpopulations on the results page.
View task progress and results
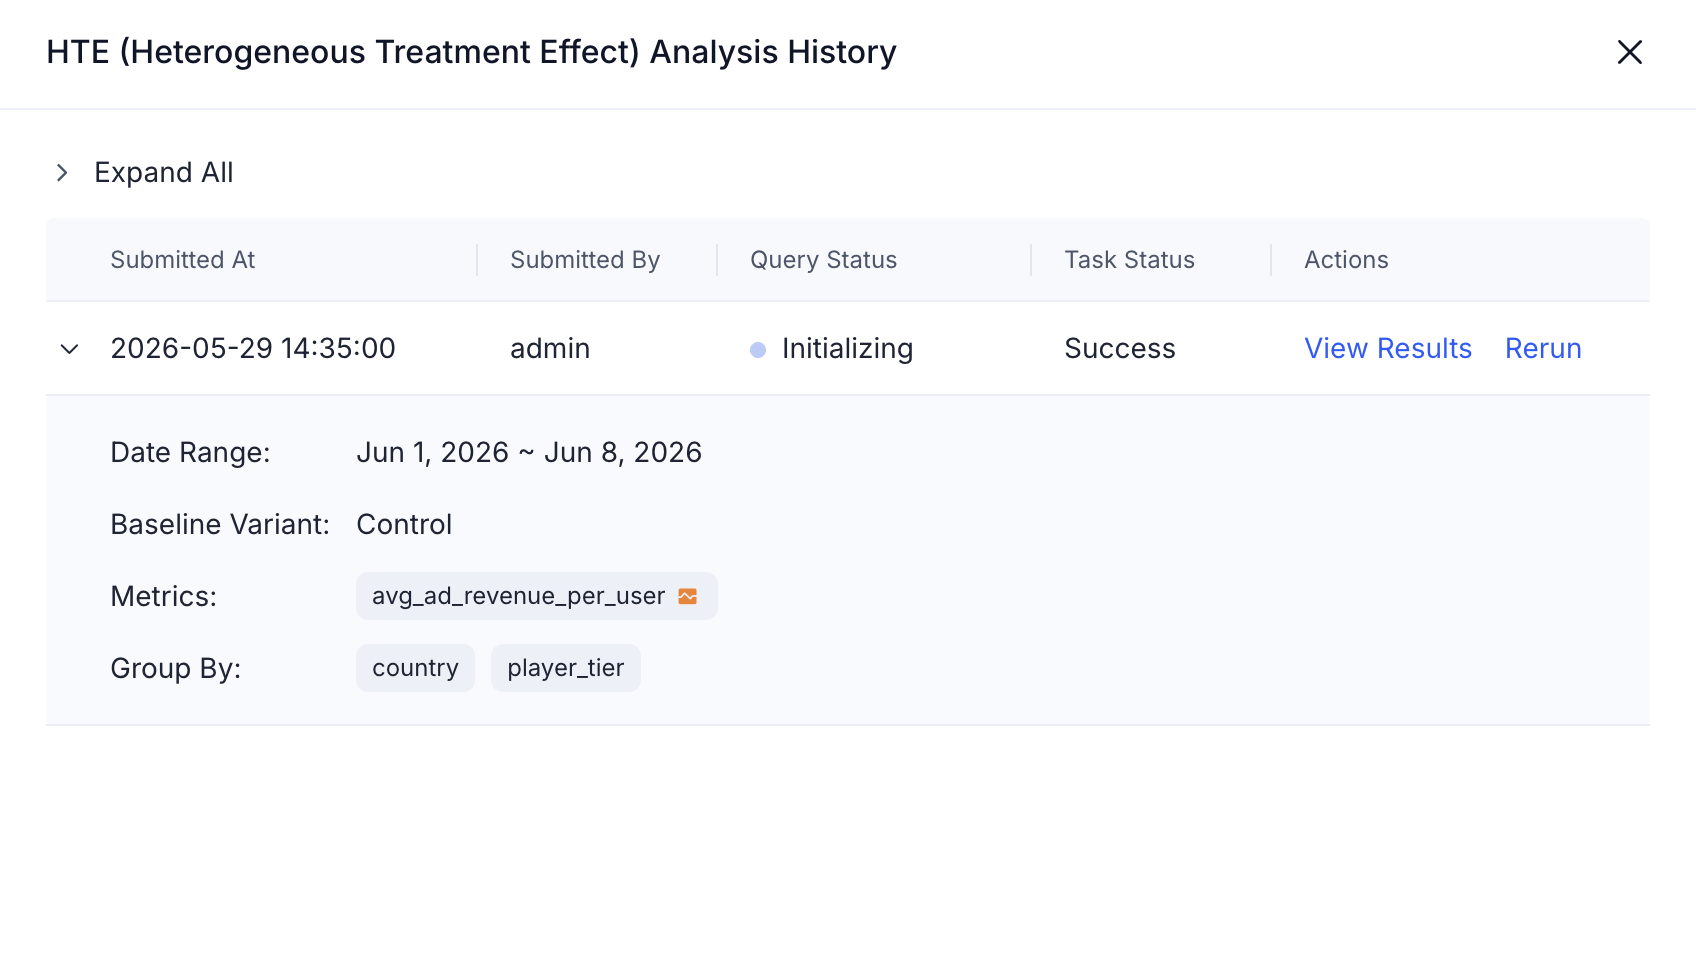
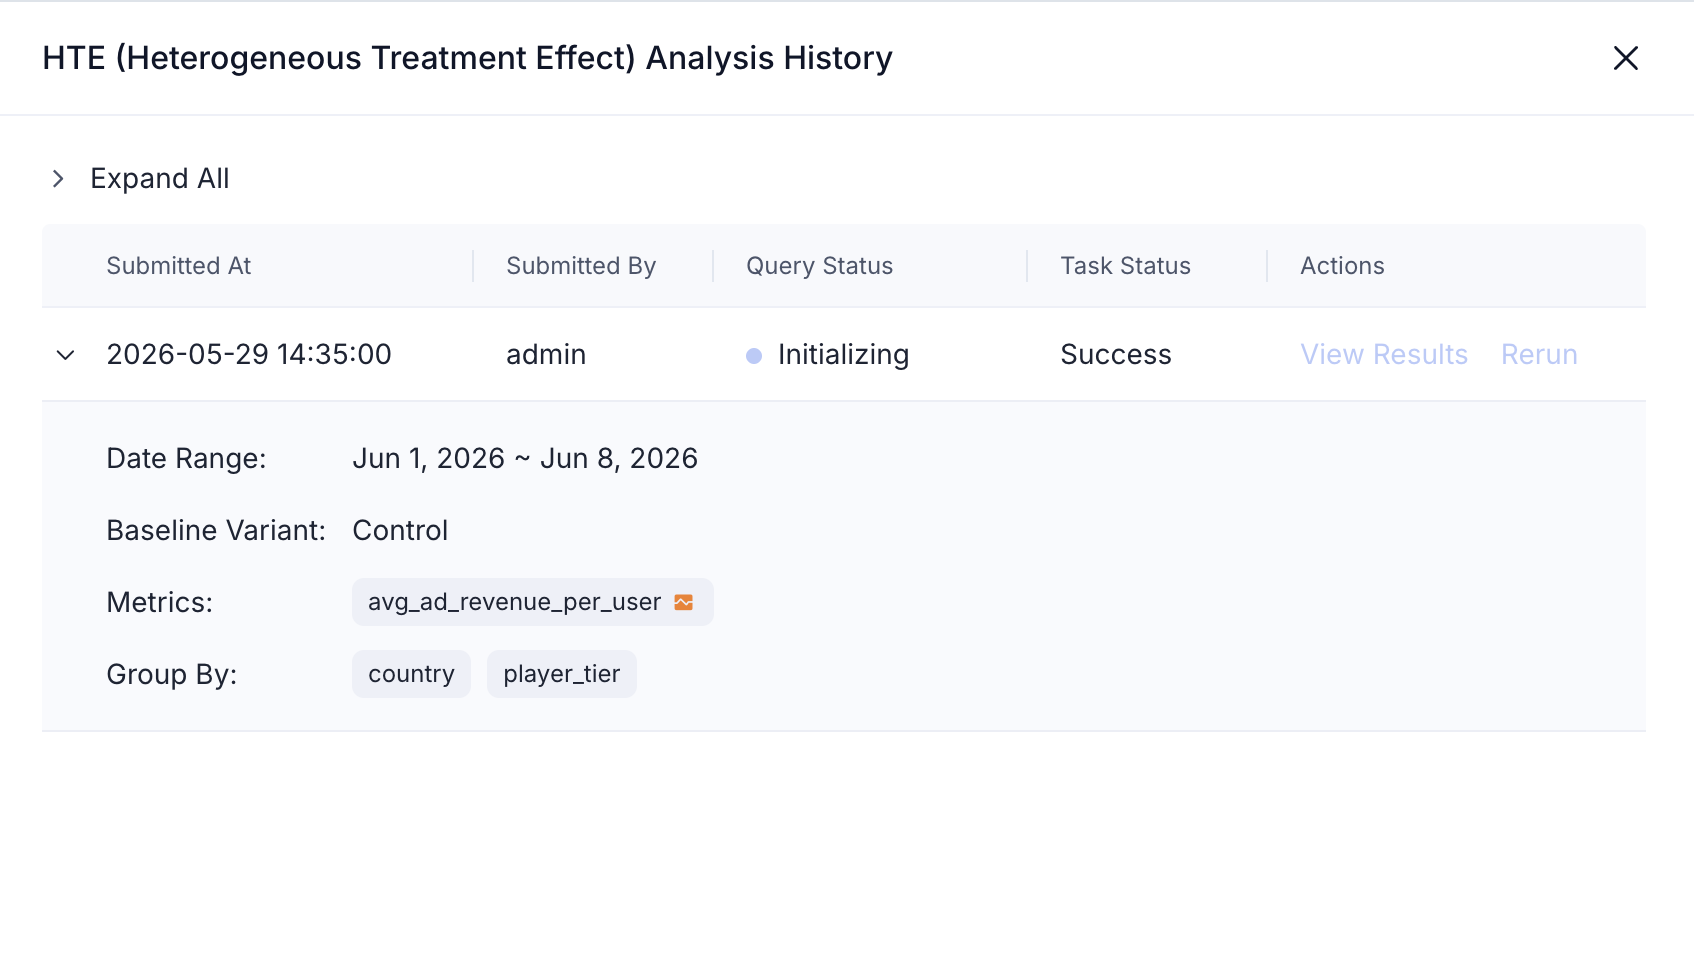
- After clicking Query to submit the HTE analysis task, the system generates a corresponding task record. Click History to view all HTE analysis records for the current experiment, including task creation time, analysis configuration, and execution status.
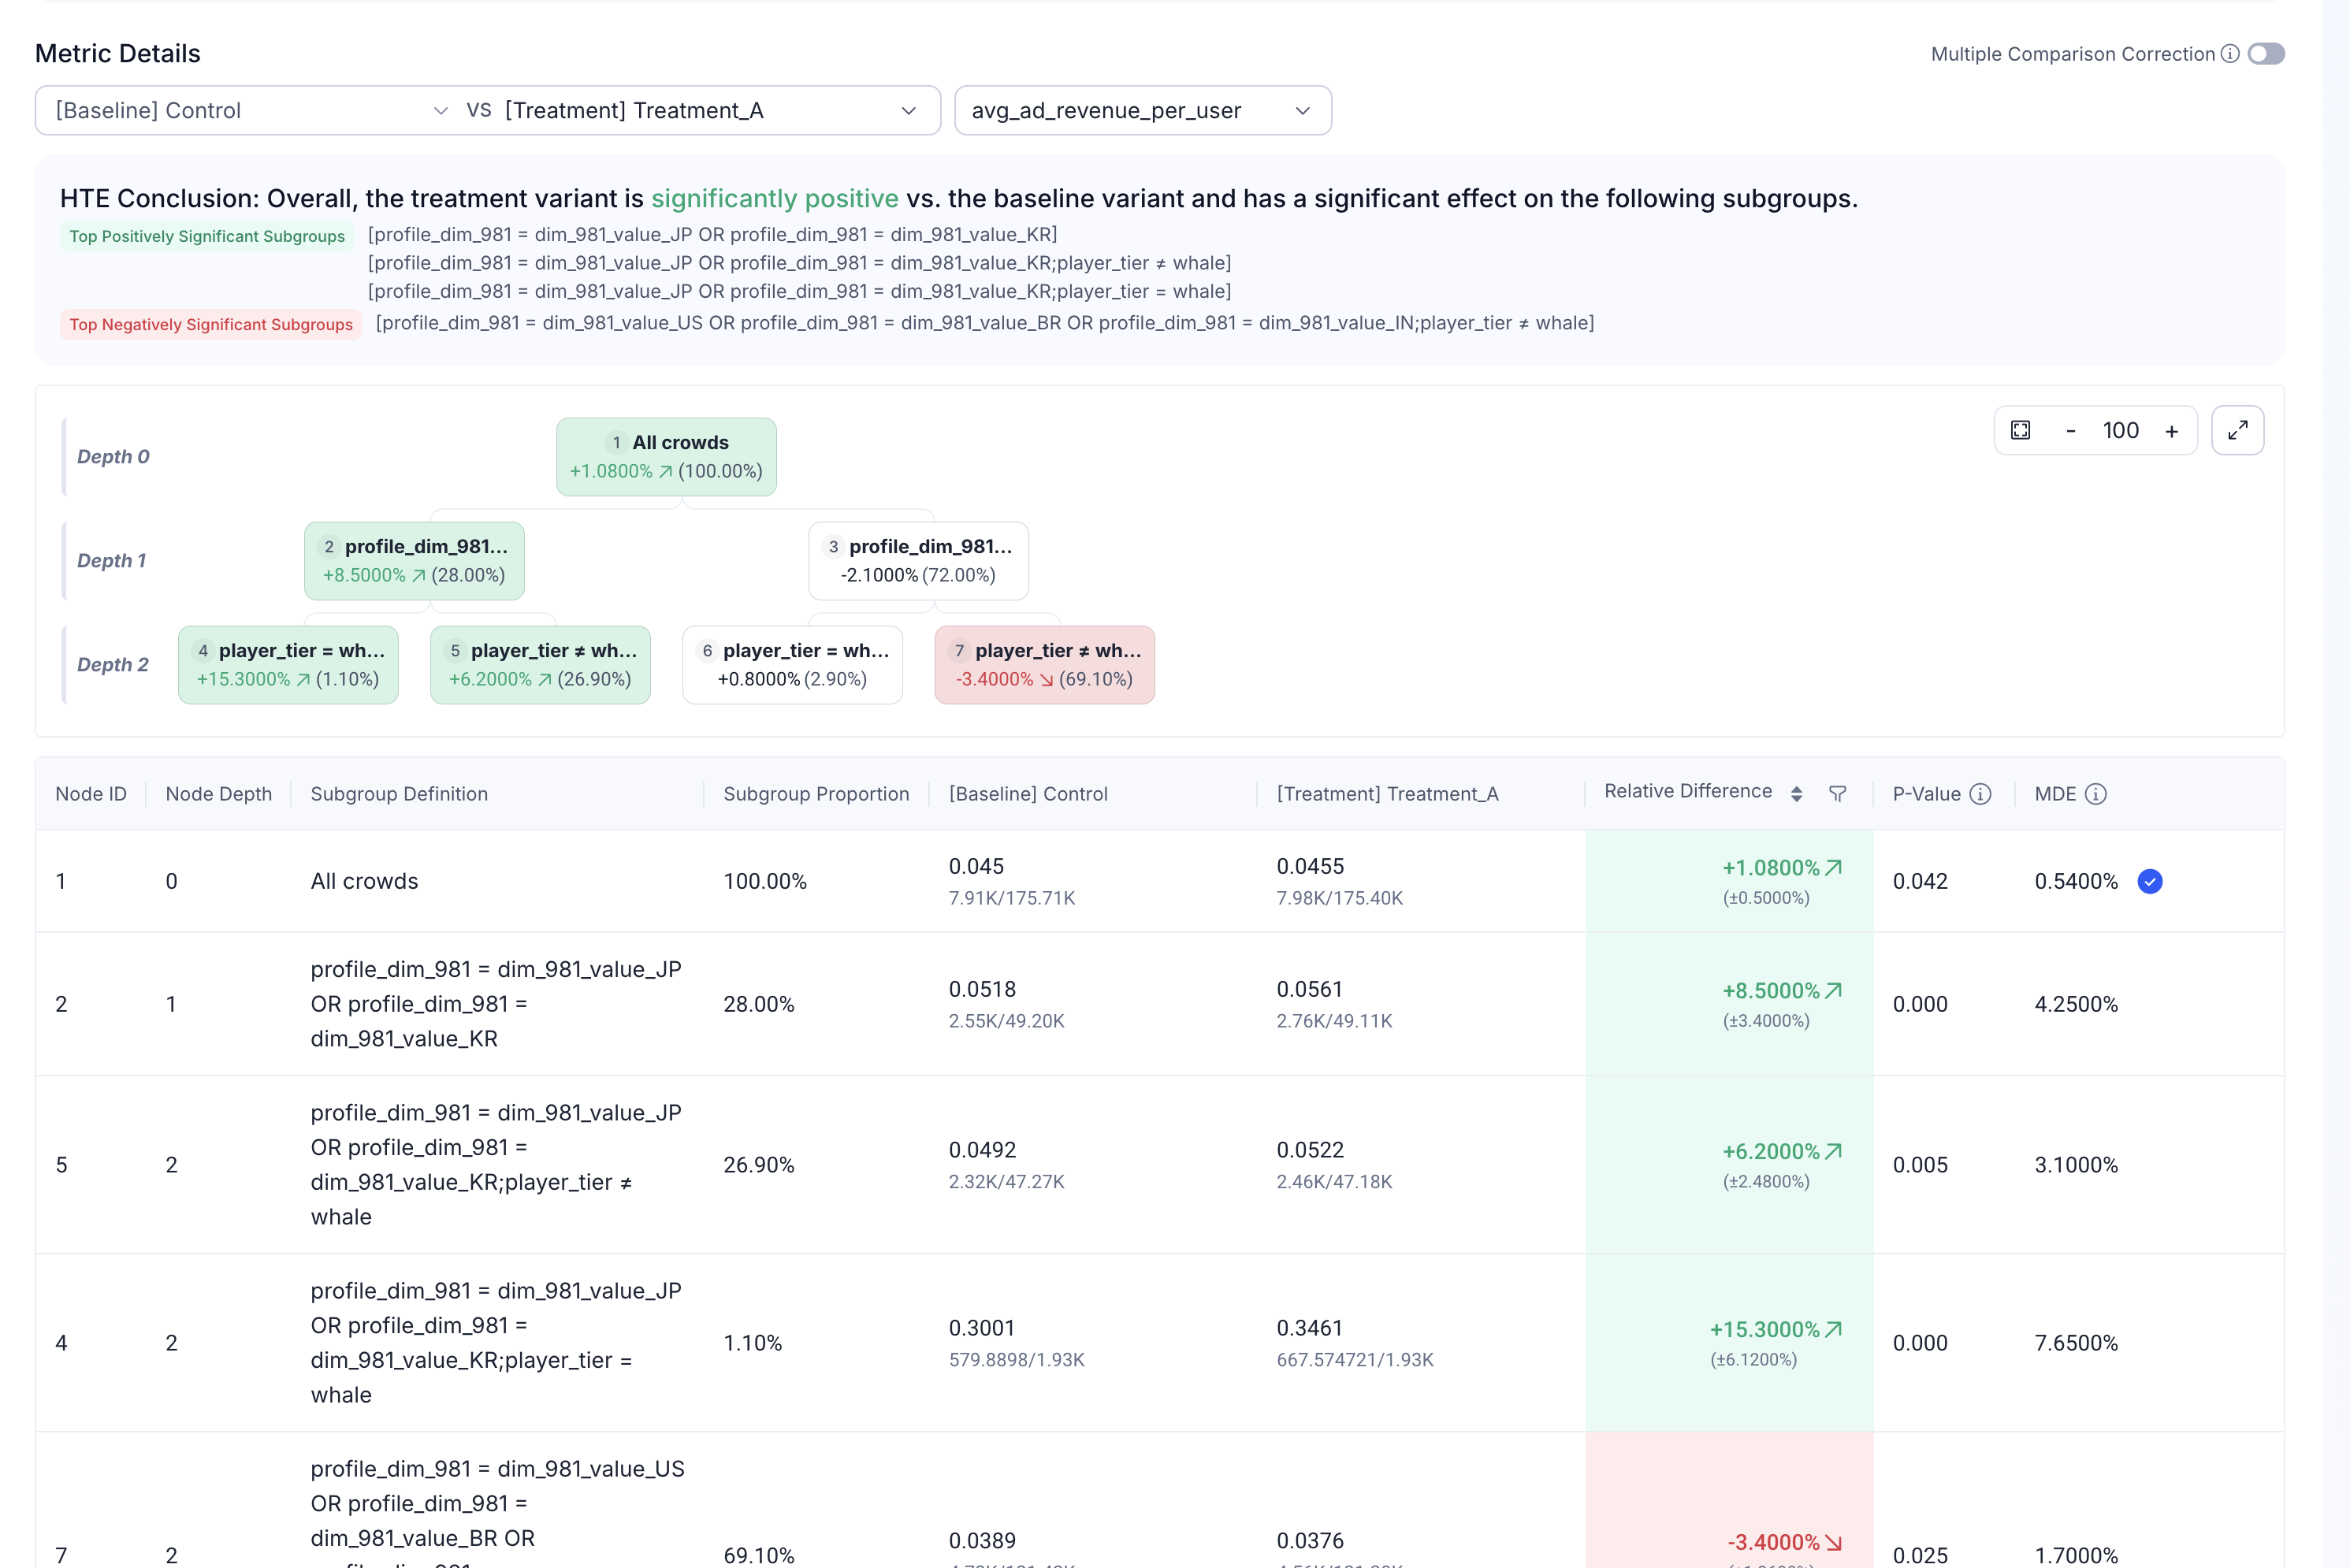
- When the task is complete, click View Result in the task record to navigate to the results page, where you can view the HTE analysis results — including the overall experiment effect, subpopulation effect differences, and related statistical information.