MAB Experiment
A MAB Experiment (Multi-Armed Bandit Experiment) is an experiment type in ABC designed for "optimize while you test" scenarios. Unlike traditional A/B with fixed traffic splits, MAB automatically allocates more traffic to better-performing variants as the experiment runs — collecting data and concentrating traffic on the winner simultaneously to minimize traffic "wasted" on inferior variants.
Why you need MAB Experiments
Traditional Layer Experiments use a "fix the traffic split first, run long enough, then decide" model — all variants bear their allocated traffic share regardless of performance, and an underperforming variant may already have caused significant opportunity cost before a decision is made.
Scenario comparison
| Business need | Traditional Layer Experiment | MAB Experiment |
|---|---|---|
| Rapid selection during a time-limited campaign | Even if one variant is clearly worse, it continues to bear fixed traffic throughout the campaign period | The system automatically shifts traffic away from poor variants and concentrates it on the winner |
| Which of 5 ad creatives has the highest click-through rate | All 5 variants must run until they reach sample size | Traffic for underperforming creatives is reduced to the minimum floor within a few hours |
| Continuous strategy iteration | Every new strategy starts with an equal traffic split from zero | Better-performing new strategies automatically receive more traffic |
| Rigorous statistical significance proof | Strong suit | MAB does not produce strict P-values — not appropriate for this |
When to use MAB Experiments
Scenario 1: Multi-creative selection during a time-limited campaign
Background: A major promotion banner has 5 candidate creatives and only a 3-day campaign window. With traditional A/B, 3 days may not be enough to reach significance; with MAB, underperforming creatives are deprioritized within hours.
| Action | Details |
|---|---|
| Optimization metric | Click-through rate (click_through_rate) |
| Traffic update frequency | Every 10 minutes |
| Calculation window | Custom window of 1 hour (avoids early data diluting recent performance) |
| Outcome | Within 12 hours, the system has concentrated roughly 80% of traffic on the highest-CTR creative, significantly boosting total clicks over the entire campaign |
Scenario 2: Continuous recommendation strategy optimization
Background: Test several new parameter combinations for a recommendation algorithm, aiming to let better-performing strategies automatically receive more traffic without hurting overall revenue.
| Action | Details |
|---|---|
| Optimization metric | Per-user ad revenue (user_ad_revenue) |
| Minimum traffic floor | 10% per variant (preserves continuous exploration) |
| Update frequency | Every 30 minutes |
| Value | No need to choose between "exploring new strategies" and "preventing revenue decline" — MAB balances them automatically |
Scenario 3: Rapid monetization pricing decisions
Background: Launching a new bundle, you want to quickly find the price point with the highest purchase rate (candidates: ¥6 / ¥12 / ¥30 / ¥68) without exposing a large number of users to suboptimal pricing for too long.
| Action | Details |
|---|---|
| Optimization metric | Bundle purchase conversion rate (gift_purchase_rate) |
| Calculation window | Custom window of 6 hours (captures daily payment peak characteristics) |
| Outcome | Traffic converges on the optimal price after 24 hours |
Scenario 4: Limiting the opportunity cost of a poor variant
Background: Testing a risky new approach — if it performs poorly, you want to limit the number of users bearing its negative impact over time.
| Action | Details |
|---|---|
| Optimization metric | User retention rate (retention_rate) |
| Initial variant traffic | Control 50% / Treatment_A 50% |
| Minimum traffic | Treatment_A 5% (if the variant is poor, a minimum 5% is retained for continued observation; the remaining traffic returns to Control) |
| Value | The minimum traffic floor creates "risk containment" — keeping the damage from a poor variant manageable |
When not to use MAB
- Critical decisions that require rigorous statistical significance (e.g., payment strategy A/B, deciding whether to ship a high-risk new feature) → use a Layer Experiment
- Fixed traffic ratios required, no variation allowed (compliance requirements, controlled experiments) → use a Layer Experiment
- Key metrics with strong seasonality or time-of-day patterns (daytime vs. nighttime behavior differs dramatically) → be cautious with MAB; time-segment noise may mislead the system
Core capabilities
1. Dynamic traffic adjustment — automatically shift toward the winner
The system re-evaluates variant performance at a set update frequency (10 / 30 / 60 minutes). Variants that perform better receive more traffic in the next cycle. Traffic is automatically pulled from underperforming variants with no manual intervention needed.
2. Minimum traffic floor — preserve exploration space
Every variant has a Minimum Traffic floor. Even if a variant is temporarily underperforming, the system retains this share for continued observation — preventing the premature "abandonment" of a variant due to short-term fluctuations.
Configuration guidance: For exploratory experiments, set the floor at 10–20%; for rapid selection during a campaign, it can be as low as 5%.
3. Flexible metric calculation window
| Window mode | When to use |
|---|---|
| Since experiment start (cumulative) | Business metrics are stable with no pronounced time-of-day variation |
| Custom window (sliding window) | Business metrics fluctuate significantly or are time-sensitive (e.g., during a campaign); avoids early data diluting recent performance |
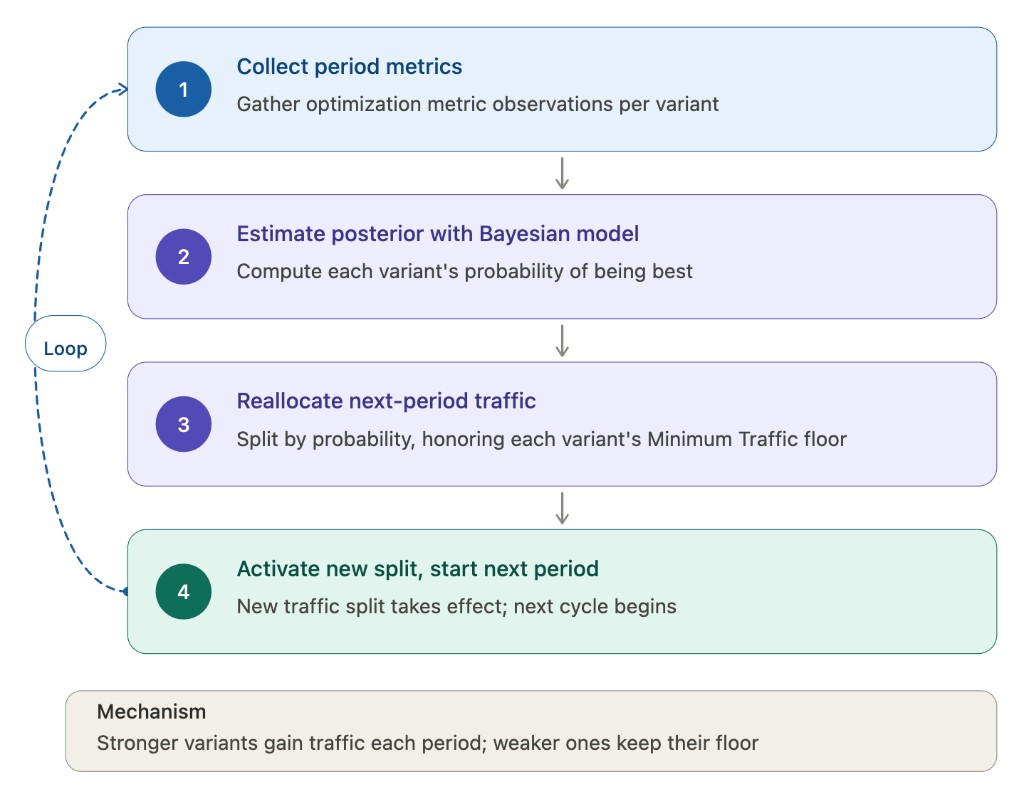
4. Probabilistic convergence — based on a Bayesian model
Unlike traditional A/B with a fixed end time, MAB determines convergence through Bayesian posterior probabilities:
- Each update cycle collects metric data for each variant
- The posterior probability of each variant being the best is computed from the accumulated data
- The Results page shows the Chance to Beat All for each variant (e.g., Control 5%, Treatment_A 95%)
Simply put: more data → more certainty about who is winning → more concentrated traffic.
Creation flow
Entry point:
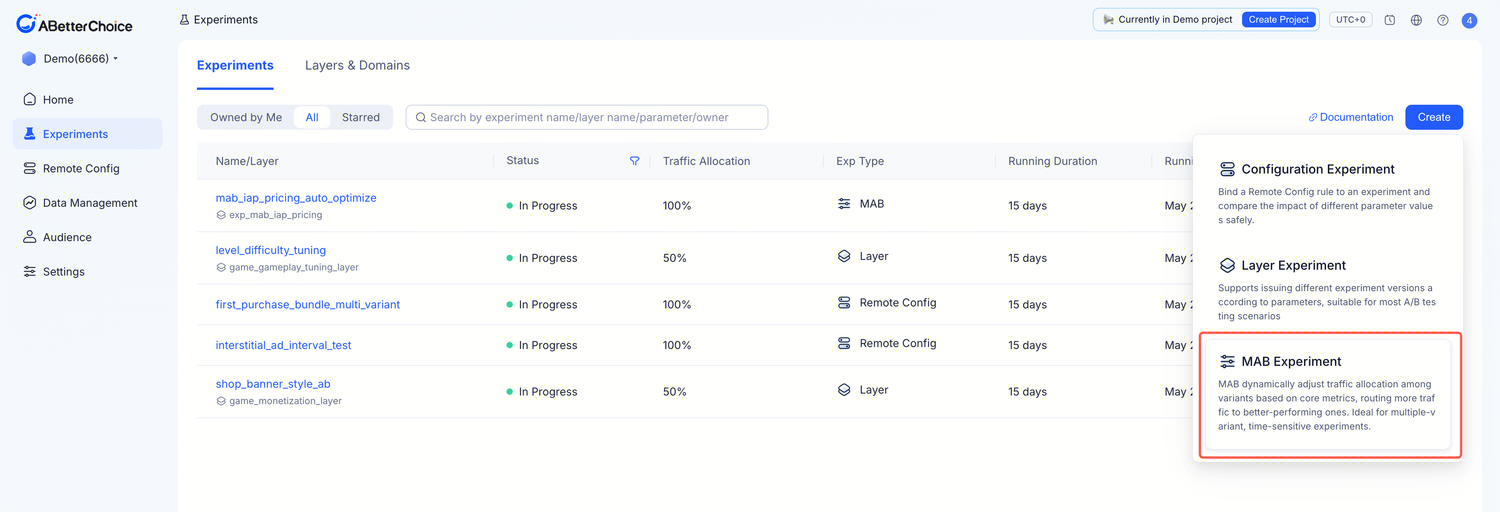
Usage flow: 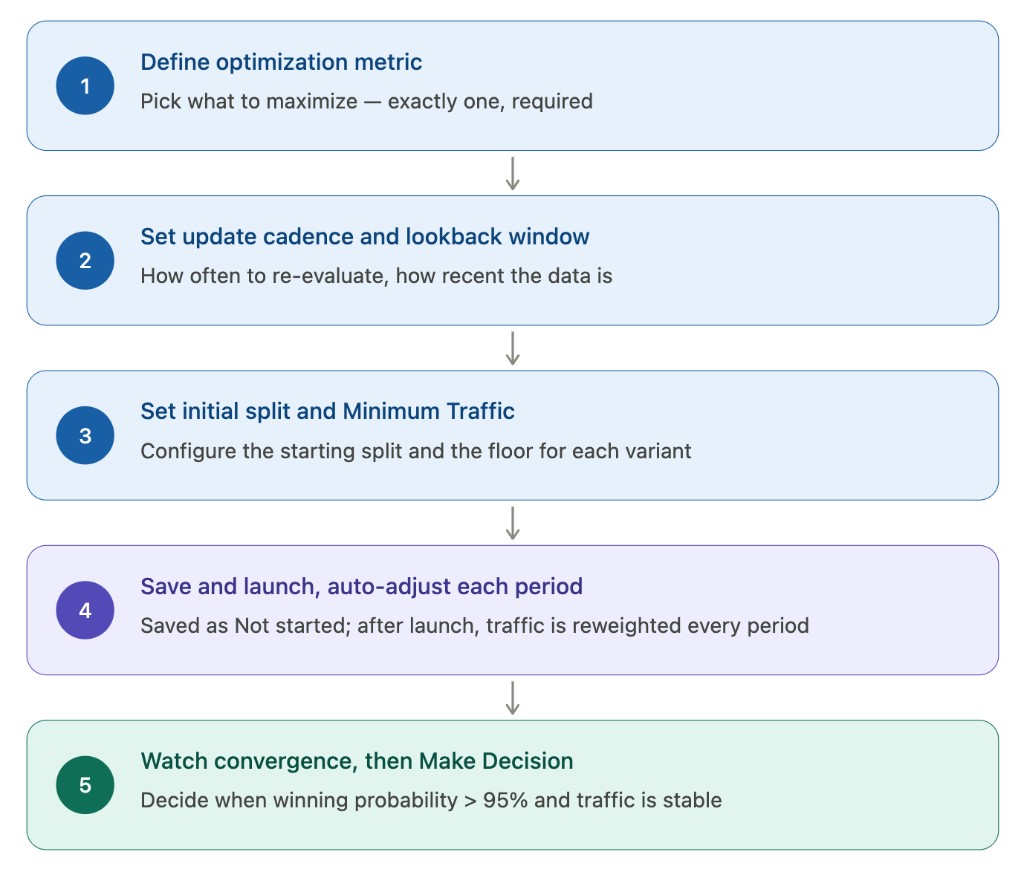
Three-section creation walkthrough
Basic information
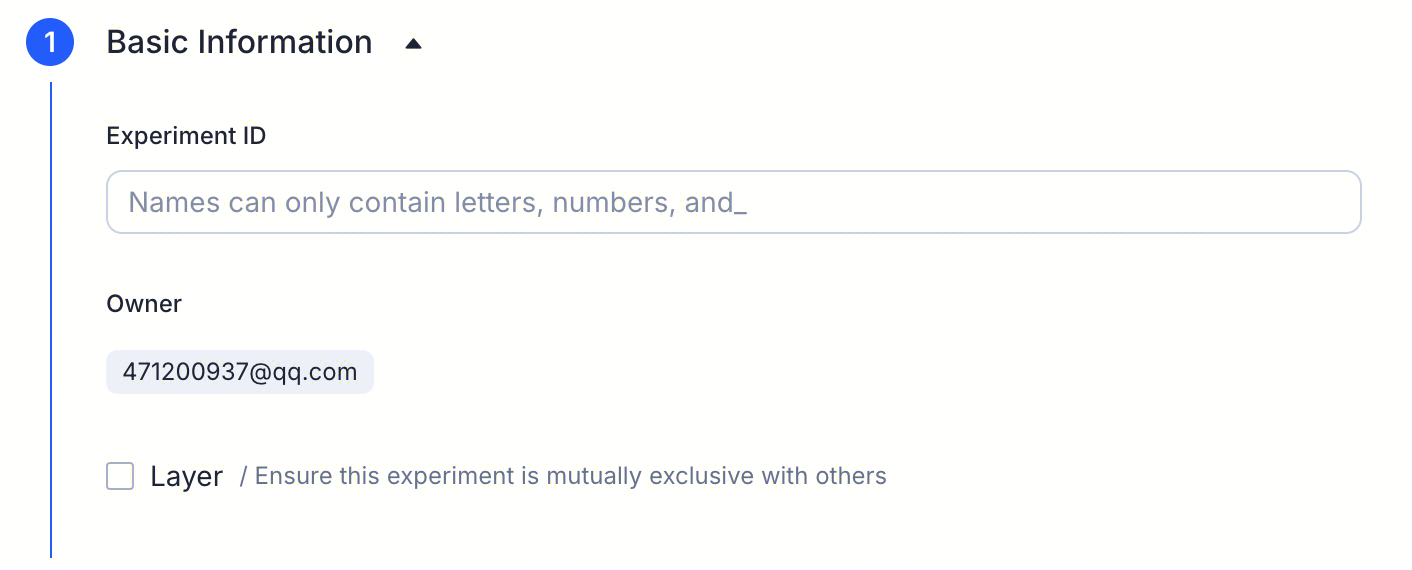
- Experiment ID: unique identifier; only letters, numbers, and underscores
- Owner: defaults to the current account
- Layer (optional): fill in if this experiment needs to be mutually exclusive with others on the same layer
Hypothesis & goals
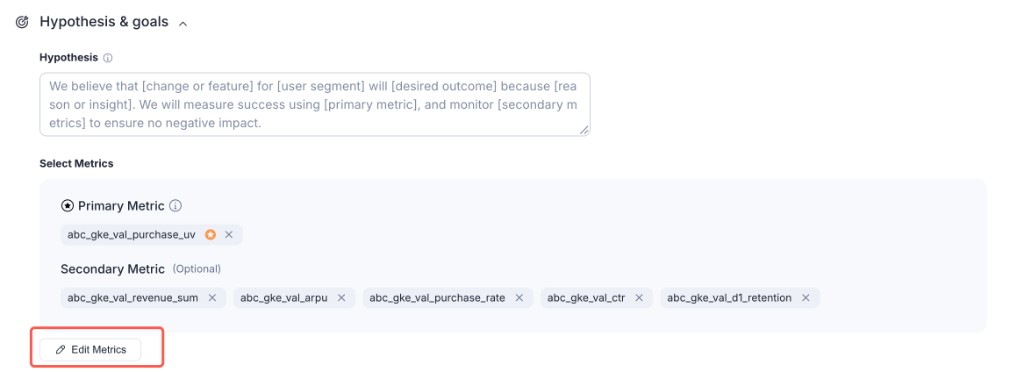
- Hypothesis: description of the experiment hypothesis
- Target Optimization Metric: exactly 1 required — the sole metric that drives MAB traffic allocation
- Observation Metrics: up to 5; for monitoring only, do not affect traffic allocation
- Traffic update frequency: 10 / 30 / 60 minutes
- Metric calculation window: cumulative / custom sliding window
Allocation and variants
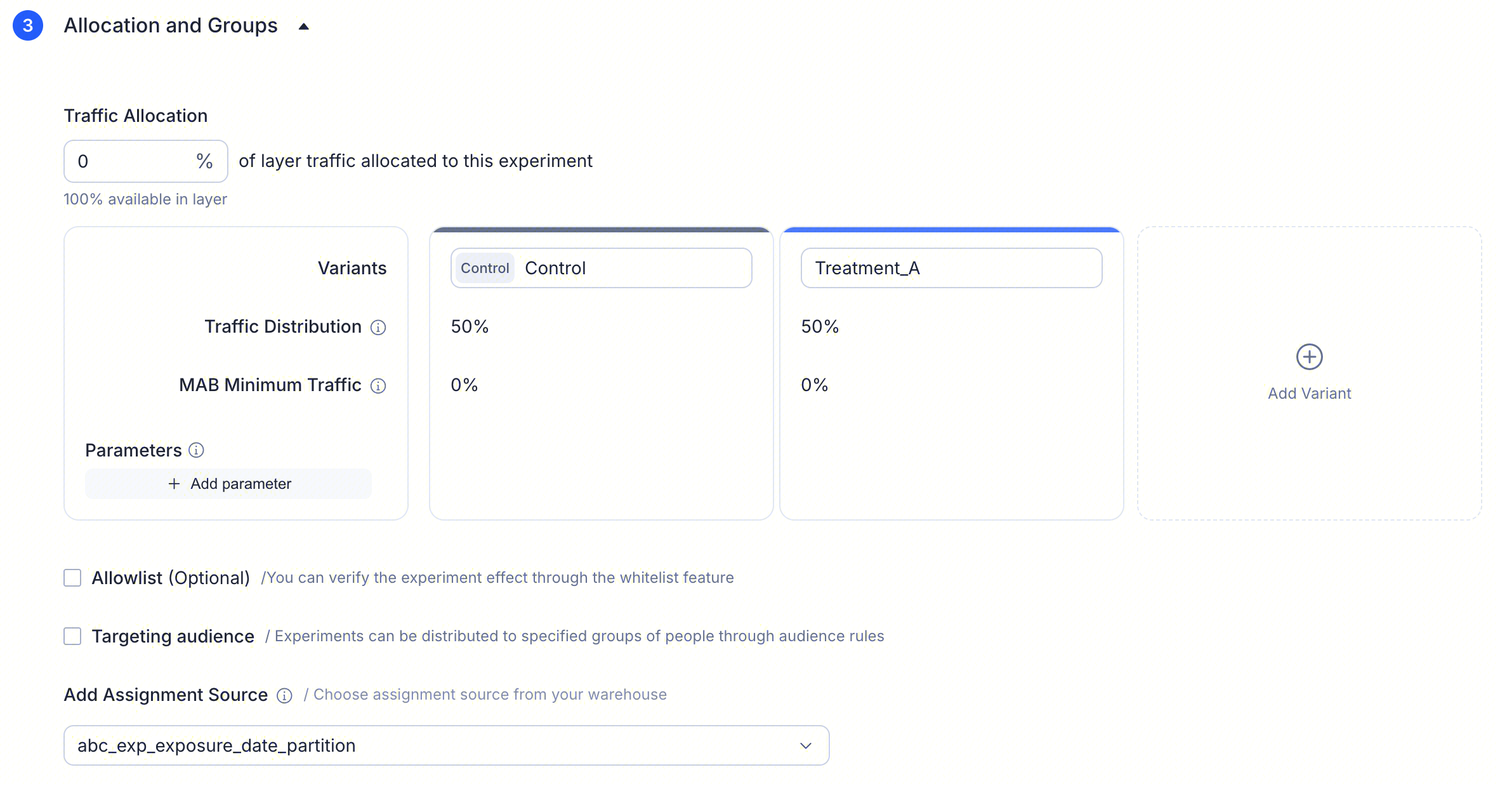
- Traffic allocation: total traffic percentage used by the experiment
- Variants: defaults to Control + Treatment_A, each at 50%
- Traffic Distribution: initial percentage for each variant
- Minimum Traffic: minimum traffic floor for the variant (cannot exceed the variant's Traffic Distribution)
- Parameters: configure different parameter values for each variant
- Allowlist (optional): for QA verification before going live
- Targeting Audience (optional): if the experiment should only apply to a specific segment
Configuration constraint: MAB Minimum Traffic cannot exceed the variant's Traffic Distribution. For example, if a variant's Traffic Distribution is 50%, its Minimum Traffic can be at most 50%.
How traffic allocation works
Every update cycle, the system executes the following steps:
Example: 1 hour after experiment start (update frequency 10 minutes; 6 cycles completed)
| Variant | Initial traffic | Current Chance to Beat All | Current traffic | Trend |
|---|---|---|---|---|
| Control | 33% | 12% | 15% | Down |
| Treatment_A | 33% | 20% | 20% | Flat |
| Treatment_B | 33% | 68% | 65% | Up |
Value summary
| Value | Specific benefit |
|---|---|
| Lower opportunity cost | Underperforming variants no longer bear traffic for the long haul; total metric output over the experiment period is significantly higher than with fixed splits |
| Faster selection | Especially clear in multi-variant scenarios — the best of 5 candidates is typically identified within 24 hours |
| Continuous exploration | Minimum traffic floor ensures continuous exploration, preventing short-term fluctuations from causing the system to prematurely abandon a variant |
| Controlled risk | Lower initial traffic + minimum traffic floor keeps the damage from a high-risk new variant manageable |
| Automated operation | No need to manually monitor and adjust traffic every day |