Warehouse Native Quickstart
This page gives the shortest path from a connected warehouse to an experiment that receives exposure data, for first-time Warehouse Native setup.
What you will accomplish

By the end of this quickstart, you will have:
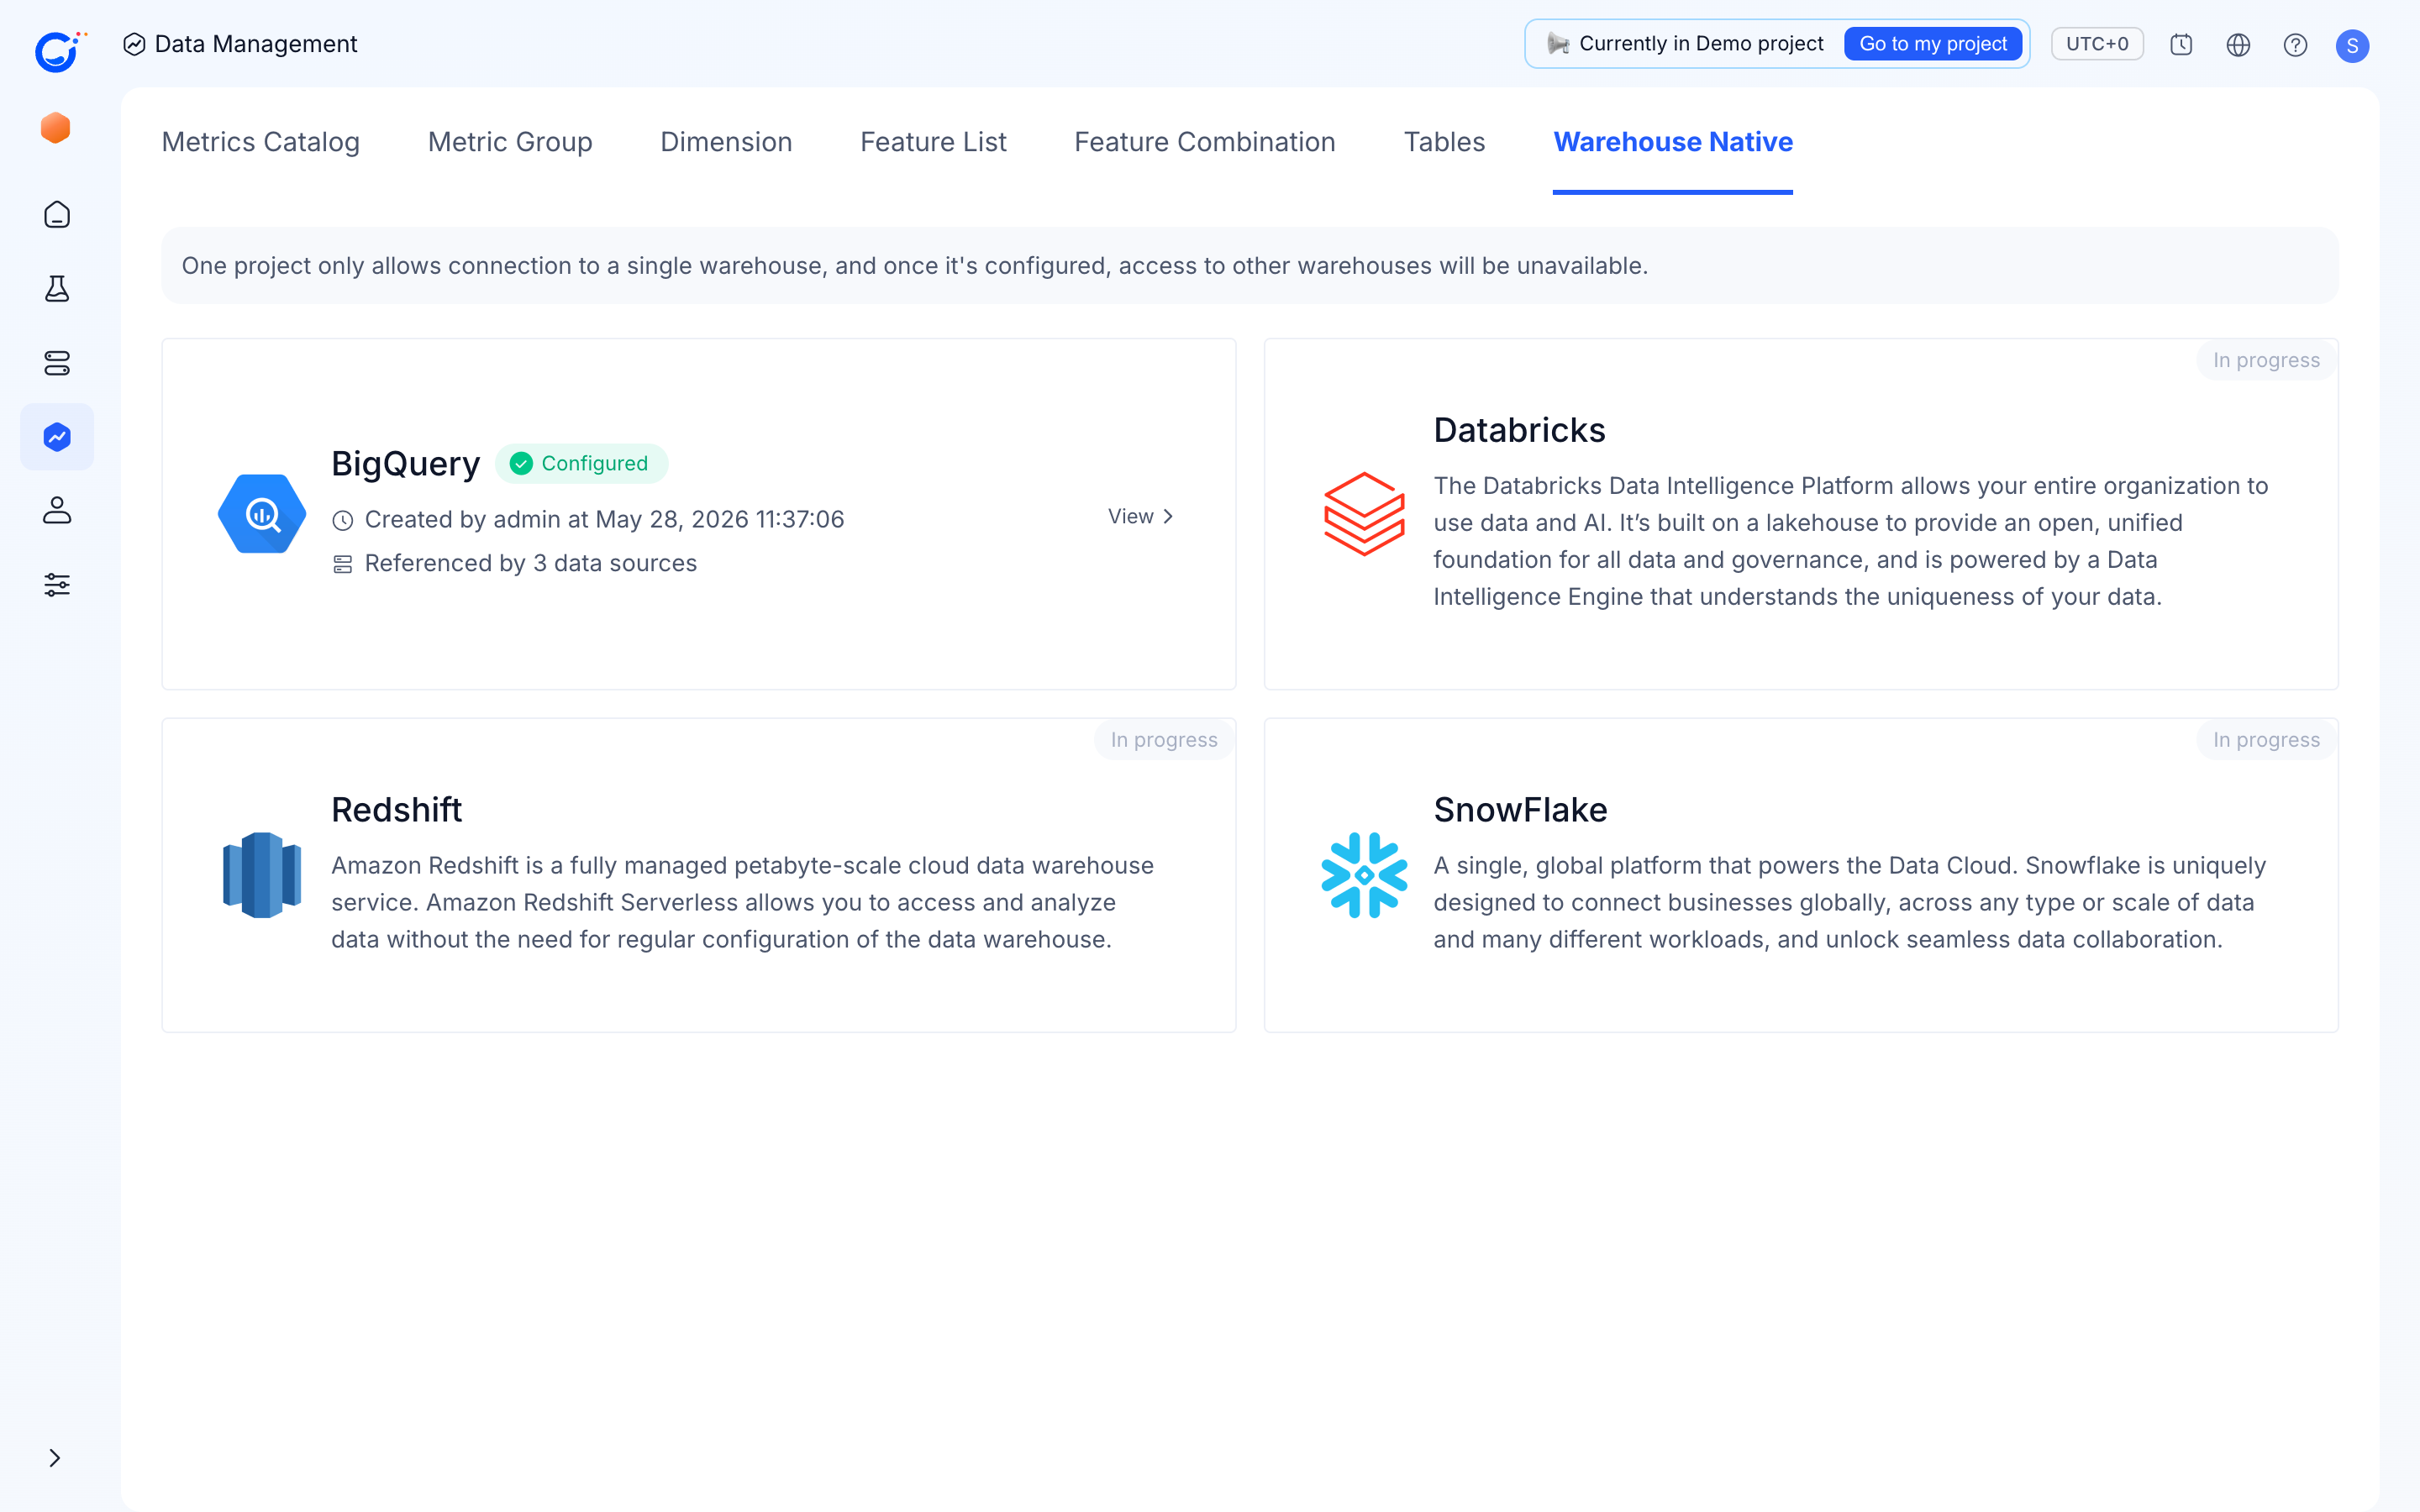
- A BigQuery connection in
Data Management → Warehouse Native. - One assignment table and one fact table registered in
Data Management → Tables. - One metric defined in
Data Management → Metrics Catalog. - One experiment that uses the assignment table as its assignment source.
- A first readout path for checking
Cumulative Exposures.
Prerequisites
- An ABetterChoice project where you have
Adminaccess. - A BigQuery project where you can grant the ABetterChoice service account read access to source datasets and write access to a result dataset.
- Existing exposure or assignment data, plus at least one fact table that can produce a simple metric.
- An SDK or event pipeline plan that can keep assignment and exposure data flowing after the experiment starts.
1. Connect BigQuery
Open Data Management → Warehouse Native, choose BigQuery, and complete the connection flow. Keep the source and result datasets separate if your warehouse governance model allows it.
For the detailed permission setup, follow BigQuery Connection.
2. Register the minimum data model
In Data Management → Tables, register:
- One assignment table for exposure or assignment records.
- One fact table for the business event or value you want to measure.
Start with the smallest model that can answer one experiment question. You can add user property data sources, more fact tables, and dimensions after the first path works. See Defining Your Data Model.
3. Define one metric
In Data Management → Metrics Catalog, create a metric on top of the fact table you registered. Choose a metric that your team can independently validate in BI, such as conversion rate, purchase count, or average session length.
See Metrics Catalog and Metric Types for the metric setup pages.
4. Create and start a test experiment
Create an experiment, select the assignment table as the assignment source, and choose the metric from the catalog. Keep the first experiment narrow: one hypothesis, one primary metric, and a traffic plan that is safe for your product.
Follow Create an Experiment for the product flow.
5. Verify the first signal
After the SDK or event pipeline emits assignment and exposure records, open the experiment results page and check Cumulative Exposures. The first goal is not a decision; it is confirming that the warehouse connection, table model, metric definition, and experiment setup all line up.